Elearnmarkets - Financial Market Learning
  • Categories
    • Basic Finance
    • Derivatives
      • Futures
      • Options
    • Financial Planning
    • Fundamental Analysis
    • Technical Analysis
    • Marketshala
    • Miscellaneous
  • Language
    • English
    • Hindi
    • Bengali
No Result
View All Result
  • Courses
  • Webinars
  • Stories
Elearnmarkets - Learn Stock Market, trading, investing for Free
No Result
View All Result
Home Technical Analysis

Broadening Triangle Pattern: A Symbol of High Volatility

Elearnmarkets by Elearnmarkets
July 22, 2023
in Technical Analysis, Charts, Patterns & Indicators
Reading Time: 3 mins read
1
18.2k
VIEWS
Share on FacebookShare on XShare on WhatsApp

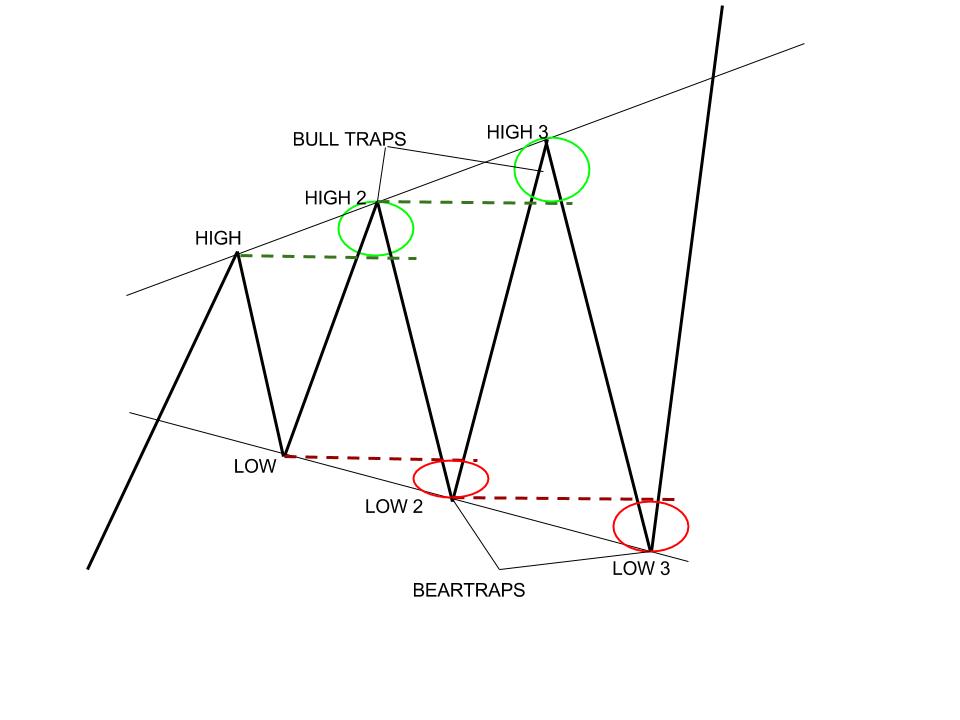
A Broadening Triangle is a relatively rare triangle pattern which occurs when there is a lot of volatility in a security.

It is formed when the prices forge higher highs and lower lows consecutively.

Table of Contents
What is Broadening Triangle?
Nifty Intraday 15 mins Chart
TataElxsi Chart
Bottomline

On joining the highs and lows with lines, a diverging pattern is seen on the chart.  This pattern stands for high volatility and several false breakouts.

Triangle pattern

What is Broadening Triangle?

While forming, it is difficult to predict the actual breakout from the pattern because of the diverging nature.

More over the tendency and requirement of surpassing the previous highs in the formation of the pattern, is a reason why breakout traders face a lot of stoploss triggers , trapping bulls when the previous peak is breached and bears when the previous low is breached and then the price turns back and returns into the pattern.

RelatedPosts

Hammer Candlestick Pattern - Formation, Example and Limitations 1

Hammer Candlestick Pattern – Formation, Example and Limitations

December 6, 2023
30.7k
Supertrend Indicator : How to use for Intraday trading? 2

Supertrend Indicator : How to use for Intraday trading?

December 6, 2023
288.9k
Top 10 Chart Patterns you should know when Trading in the Stock Market 3

Top 10 Chart Patterns you should know when Trading in the Stock Market

December 5, 2023
167.4k

The direction in which the final breakout will occur is also very difficult to predict in the Broadening Triangle pattern.

In the charts below, let us take some real -life examples of the broadening triangle.

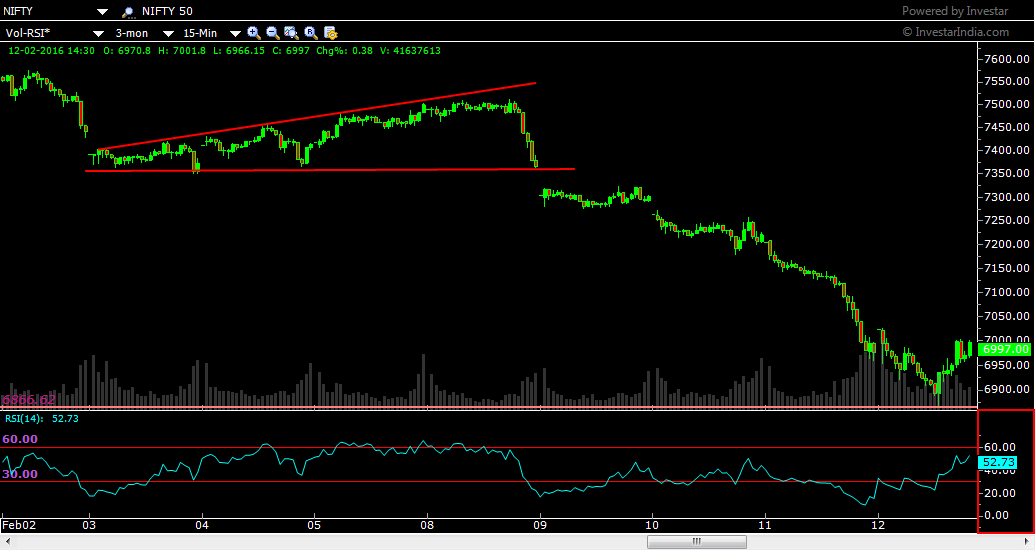
Example 1 – Nifty Intraday 15 mins Chart

A broadening triangle had occurred on the chart on the 3rd and 4th of Feb, which gave a downside breakout and lead to a severe correction in the price.

The appearance of a gap on the breakout adds to the important and surety of the breakout.

Nifty intraday chart showing the Broadening Triangle

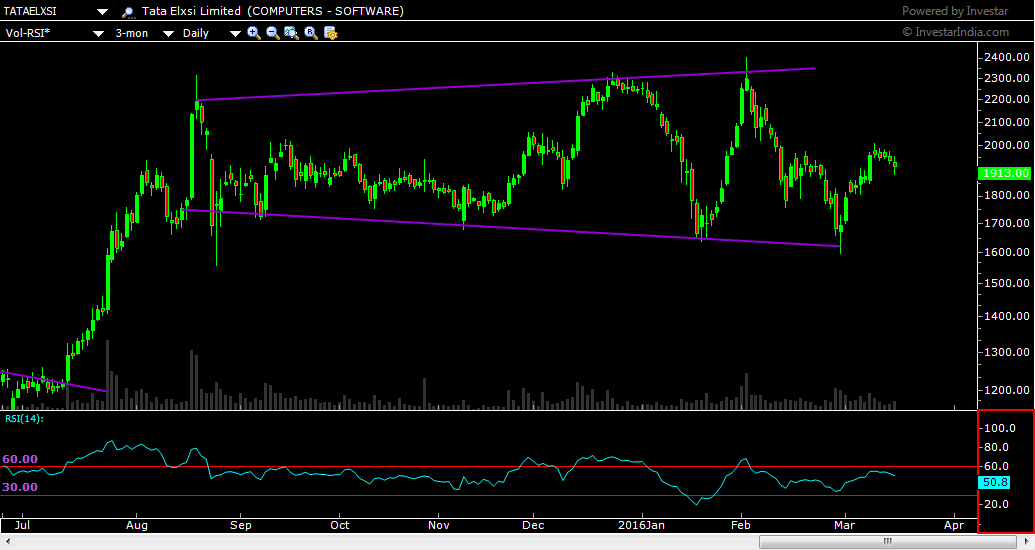
Example – TataElxsi Chart

The next example is on the chart of TataElxsi where the pattern has occurred very close to the top of the chart and has not given a decisive breakout yet.

tataelxsi broadening yriangle
TATAELXSI showing a Broadening Triangle pattern near its top.

Bottomline:

The volumes play an important role in the development of this pattern.

As the pattern unfolds, the volume keeps falling, until finally, the breakout comes wherein the volume shoot up.

We have already discussed that this pattern is a rather confusing one and is a nightmare for the traders who trade breakouts.

It is strong advice that pattern traders either don’t practice this pattern or work on it with the assistance of other technical indicators to make their analysis doubly sure.

Rather than using the laggard indicators like moving average, it is better to use leading indicators like momentum oscillators like the Relative Strength Index(RSI)

Keep Learning!!

Use our Stockedge to get access to various fundamental and technical scans of the financial markets.

Tags: advanceenglish
ShareTweetSend
Get Kotak Offer Get Kotak Offer Get Kotak Offer
Previous Post

IFCI set to fly high with a classic Flag Pattern in chart!

Next Post

Various mode of gold investment

Elearnmarkets

Elearnmarkets

Elearnmarkets (ELM) is a complete financial market portal where the market experts have taken the onus to spread financial education. ELM constantly experiments with new education methodologies and technologies to make financial education effective, affordable and accessible to all. You can connect with us on Twitter @elearnmarkets.

Related Posts

Hammer Candlestick Pattern - Formation, Example and Limitations 4
Technical Analysis

Hammer Candlestick Pattern – Formation, Example and Limitations

December 6, 2023
30.7k
Supertrend Indicator : How to use for Intraday trading? 5
Technical Analysis

Supertrend Indicator : How to use for Intraday trading?

December 6, 2023
288.9k
Top 10 Chart Patterns you should know when Trading in the Stock Market 6
Technical Analysis

Top 10 Chart Patterns you should know when Trading in the Stock Market

December 5, 2023
167.4k
5 Powerful Bearish Candlestick Patterns 7
Technical Analysis

5 Powerful Bearish Candlestick Patterns

November 30, 2023
98.7k

Comments 1

  1. frolep rotrem says:
    4 years ago

    Definitely, what a splendid website and revealing posts, I surely will bookmark your website.Best Regards!

    Reply

Leave a Reply Cancel reply

Your email address will not be published. Required fields are marked *

Elearnmarkets Logo

Follow Us

Facebook-f Twitter Instagram Linkedin-in Youtube Telegram

Register on Elearnmarkets

Continue your financial learning by creating your own account on Elearnmarkets.com

Register Free Account

Download App

Playstore logo
Download on app store

Categories

  • Basic Finance
  • Derivatives
  • Financial Planning
  • Fundamental Analysis
  • Technical Analysis
  • Marketshala
  • Miscellaneous

Popular On Elearnmarkets

  • Market Superheroes:
  • Vivek Bajaj
  • Chetan Panchamia
  • Ashish Kyal
  • Premal Parekh
  • Abhijit Paul
  • Jegan
  • Sivakumar Jayachadran
  • Vishal Malkan
  • Jyoti Budhia
  • Vivek Gadodia
  • Vishal Mehta
  • Piyush Chaudhry
  • Santosh Pasi
  • Gomathi Shankar
  • Market Superheroes:
  • Vivek Bajaj
  • Chetan Panchamia
  • Ashish Kyal
  • Premal Parekh
  • Abhijit Paul
  • Jegan
  • Sivakumar Jayachadran
  • Vishal Malkan
  • Jyoti Budhia
  • Vivek Gadodia
  • Vishal Mehta
  • Piyush Chaudhry
  • Santosh Pasi
  • Gomathi Shankar
  • Courses:​
  • Options Trading
  • Dow Theory
  • Momentum Trading
  • Stock Investing
  • Stock Market for Beginners
  • Harmonic Chart Patterns
  • Algo Trading
  • Elliot Wave Theory
  • Advanced Excel
  • Cryptocurrency
  • NSE Certification Course
  • Courses:​
  • Options Trading
  • Dow Theory
  • Momentum Trading
  • Stock Investing
  • Stock Market for Beginners
  • Harmonic Chart Patterns
  • Algo Trading
  • Elliot Wave Theory
  • Advanced Excel
  • Cryptocurrency
  • NSE Certification Course
  • Webinars:
  • Bank Nifty Scalping
  • Intraday Trading Strategies
  • Options Trading Strategies
  • Options selling
  • Price Action
  • Relative Strength
  • Tax Planning
  • Options Buying
  • Growth Stocks
  • Portfolio Management
  • Relative Strength Index
  • Risk Management
  • Renko Charts
  • Crude Oil
  • Traders Psychology
  • Moving Average
  • Multibagger Stocks
  • Free Learning Modules:
  • Intraday Trading
  • Options Scalping
  • Swing Trading
  • Financial Modelling
  • RSI Indicator
  • Bollinger Bands
  • Pricing of Futures
  • Personal Finance
  • Initial Public Offerings (IPO)
  • Value Investing
  • Technical Indicators
  • Candlesticks
  • Chart Patterns
  • Option Greeks
  • ELSS Funds
  • Banking and Insurance
  • Real Estate
  • Gold
  • Book Summaries:
  • Rich Dad Poor Dad
  • Psychology of Money
  • The Intelligent Investor
  • The Richest Man in Babylon
  • Think and Trade Like a Champion
  • Value Investing and Behavioural Finance
  • Trading in the Zone
  • Learn to Earn
  • Book Summaries:
  • Rich Dad Poor Dad
  • Psychology of Money
  • The Intelligent Investor
  • The Richest Man in Babylon
  • Think and Trade Like a Champion
  • Value Investing and Behavioural Finance
  • Trading in the Zone
  • Learn to Earn
  • Tools:
  • CAGR Calculator
  • SIP Calculator
  • eLearnOptions
  • Future Value Calculator
  • Present Value Calculator
  • Atal Pension Yojana
  • Cost of Delay Calculator
  • Become a Crorepati
  • Tools:
  • CAGR Calculator
  • SIP Calculator
  • eLearnOptions
  • Future Value Calculator
  • Present Value Calculator
  • Atal Pension Yojana
  • Cost of Delay Calculator
  • Become a Crorepati

© 2023 Elearnmarkets. All Rights Reserved

  • Visit Elearnmarkets
  • Courses
  • Webinars
  • Financial Guides
  • Get Free Counselling
  • Visit Elearnmarkets
  • Courses
  • Webinars
  • Financial Guides
  • Get Free Counselling

Get Elearnmarkets App

No Result
View All Result
  • Article Categories
    • Basic Finance
    • Derivatives
    • Financial Planning
    • Fundamental Analysis
    • Technical Analysis
    • Marketshala
    • Miscellaneous
  • Language
    • Hindi
    • Bengali
    • English
  • Courses
  • Webinars
  • Stories

© 2020 Elearnmarkets All Rights Reserved

A Handbook of Technical Analysis
To start your trading journey as a seasoned technical analyst
Download Now
Guidebook On Chart Patterns
Take Your Trading To The Next Level With Strategies Shared In This Ebook
Download Now
Maximum Mentorship
Maximum Mentorship - Trading Mentorship Program