Elearnmarkets - Financial Market Learning
  • Categories
    • Basic Finance
    • Derivatives
      • Futures
      • Options
    • Financial Planning
    • Fundamental Analysis
    • Technical Analysis
    • Marketshala
    • Miscellaneous
  • Language
    • English
    • Hindi
    • Bengali
No Result
View All Result
  • Courses
  • Webinars
  • Stories
Elearnmarkets - Learn Stock Market, trading, investing for Free
No Result
View All Result
Home Technical Analysis Charts, Patterns & Indicators
Harami Pattern

INSIDE DAY: Indication of Impending Change Through Candle Sticks

Elearnmarkets by Elearnmarkets
July 25, 2023
in Charts, Patterns & Indicators, Technical Analysis
Reading Time: 4 mins read
5
9.6k
VIEWS
Share on FacebookShare on XShare on WhatsApp

Candlestick charts are a very useful tool for analyzing trader’s psychology and undercurrents in price momentum.

Every aspect of a candlestick plays a role, may it be the color of the body, the length of the wick/tail, and size of the body.

A candle-stick maybe studied individually or in a cluster, depending on factors such as the momentum preceding the candlestick pattern, which also contributes to the effectiveness of the pattern.

Also Read:  All you need to know about the Japanese Candlestick

In this post, we will talk about two types of Inside Day Candle-Stick Patterns: the Bearish Harami and the Bullish Harami.

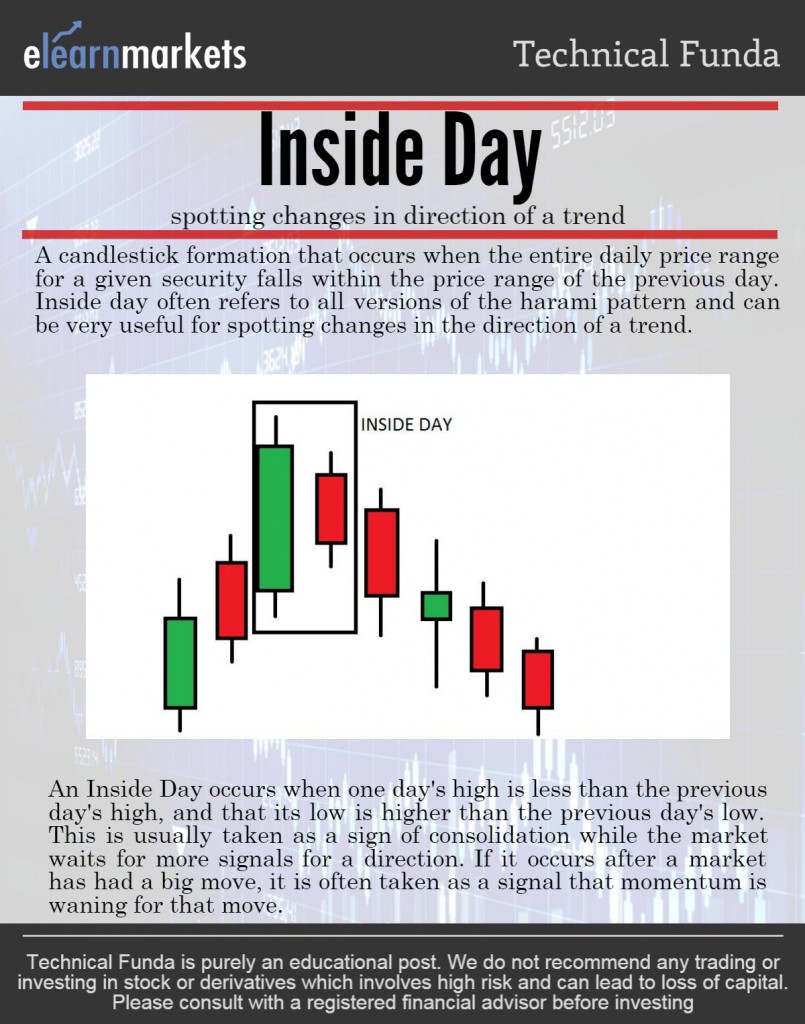
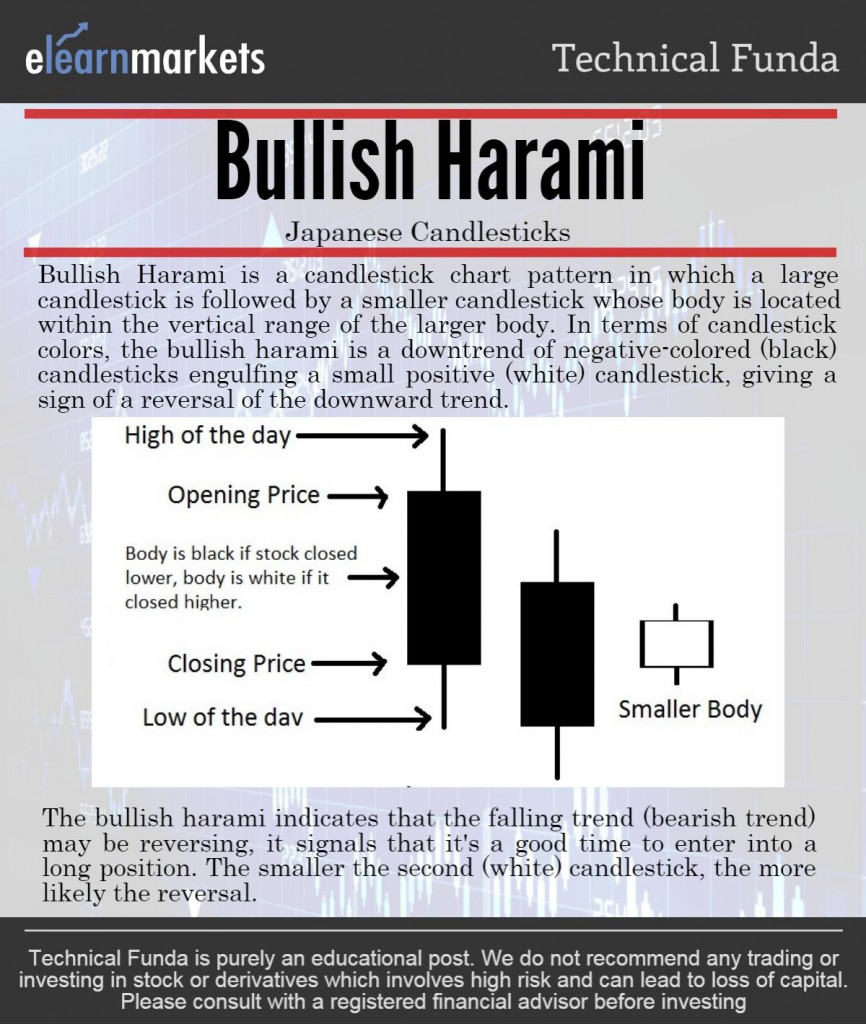
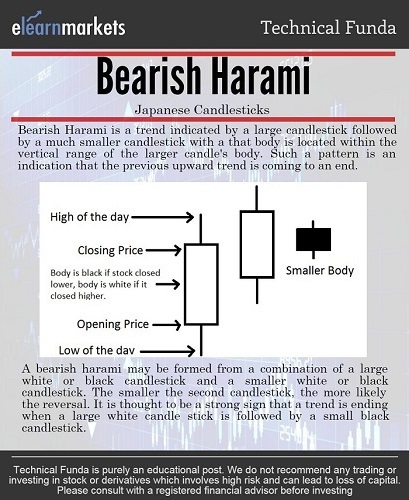
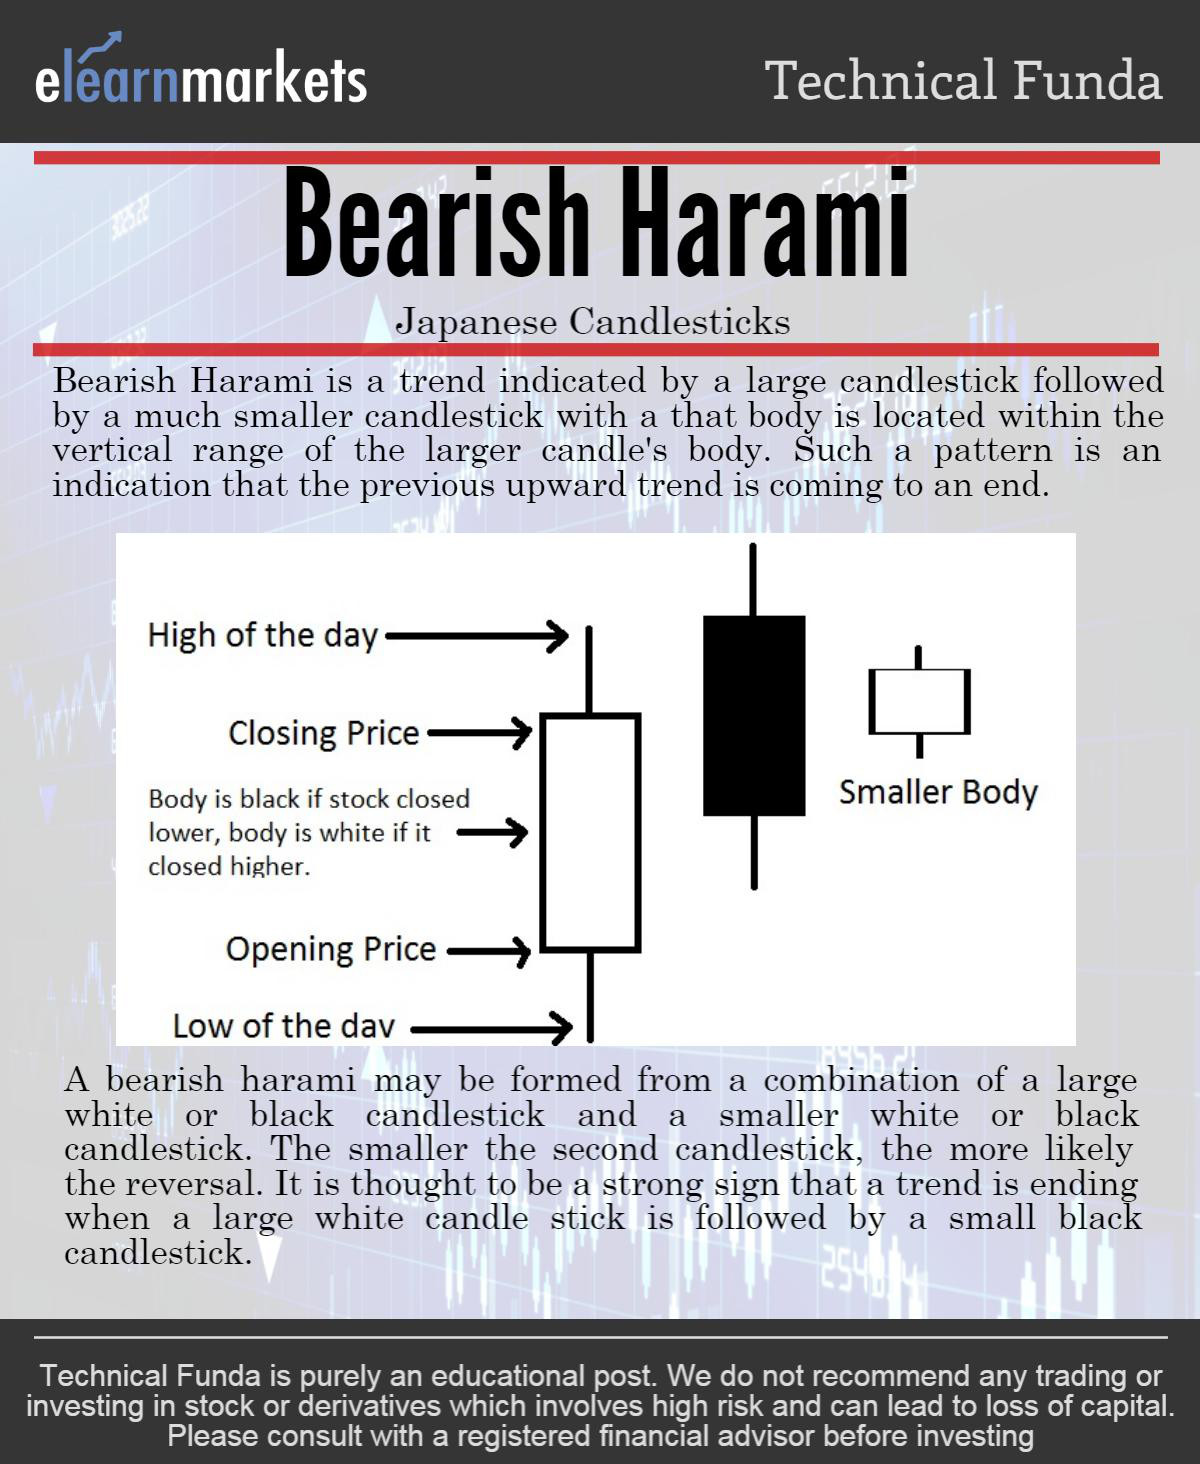
The Inside day is that candle-stick when the day’s range, that is the high and low, were within the range of the previous day. So, it looks like a long-bodied candlestick, followed by a small bodied-candlestick. In Japanese candle-stick term,  this two-period formation is called a ‘Harami’ pattern. Harami in Japanese means ‘pregnant woman’, which is so called because of the look of the pattern. Now, whether the pattern is bullish or bearish depends upon the following criteria:

  • The trend preceding the formation of the pattern.
  • The color of the inside day.
  • The confirmation within next three trading periods.
Bearish harami
bullish harami

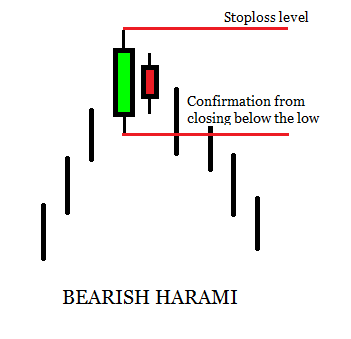
In an uptrend, the occurrence of the Harami pattern, with a red Inside Day, is an indication that the trend is losing momentum and the buying streak is cooling off. A closing below the low of the first candle of the Harami pattern is a confirmation of the pattern and serves as the sell signal with high of the pattern as stop-loss.

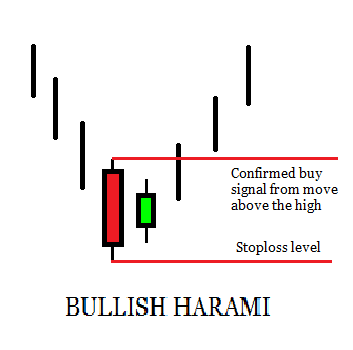
Similarly, in a downtrend, the occurrence of a Harami with a green Inside Day is an indication that the selling pressure is subsiding and a move above the high of the first candle is a confirmation of the Harami buy with the low as stop-loss.

RelatedPosts

5 Tools to Spot Trend Reversals in Stocks 5

5 Tools to Spot Trend Reversals in Stocks

September 28, 2023
6.4k
Beginner's Guide to Trading Penny Stocks 6

Beginner’s Guide to Trading Penny Stocks

September 26, 2023
1.9k
5 Important Volatility Indicators that Traders should know 7

5 Important Volatility Indicators that Traders should know

September 19, 2023
58.5k

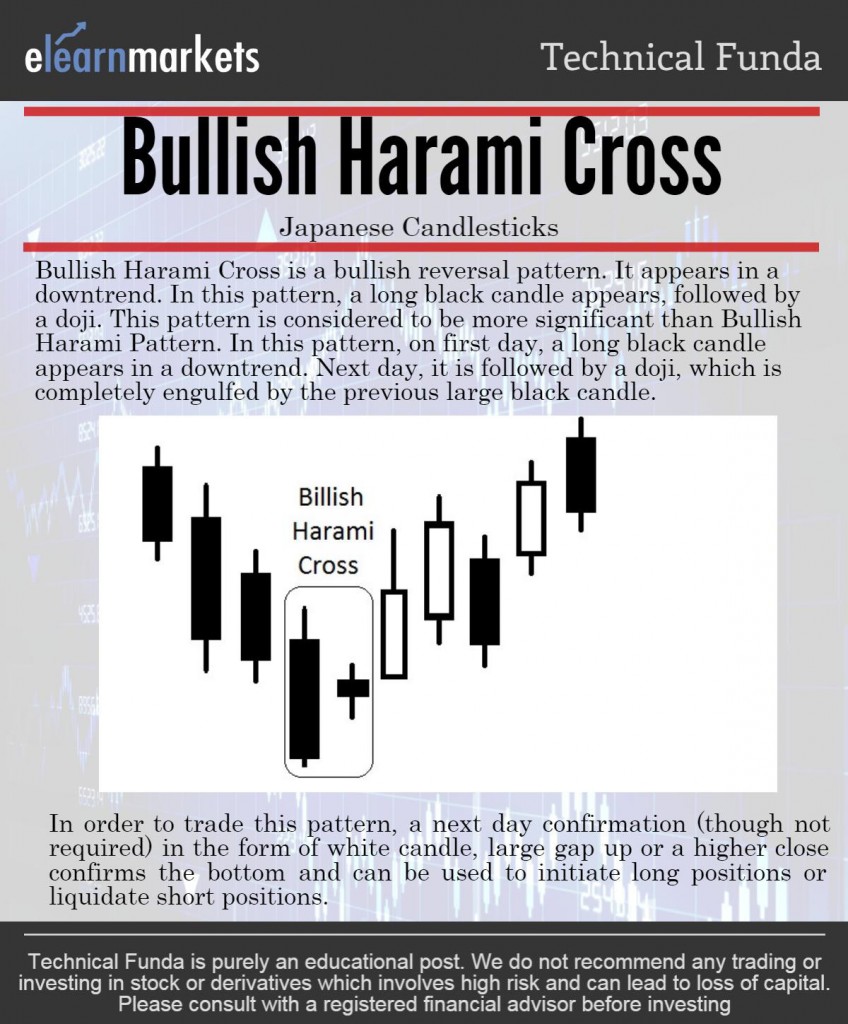
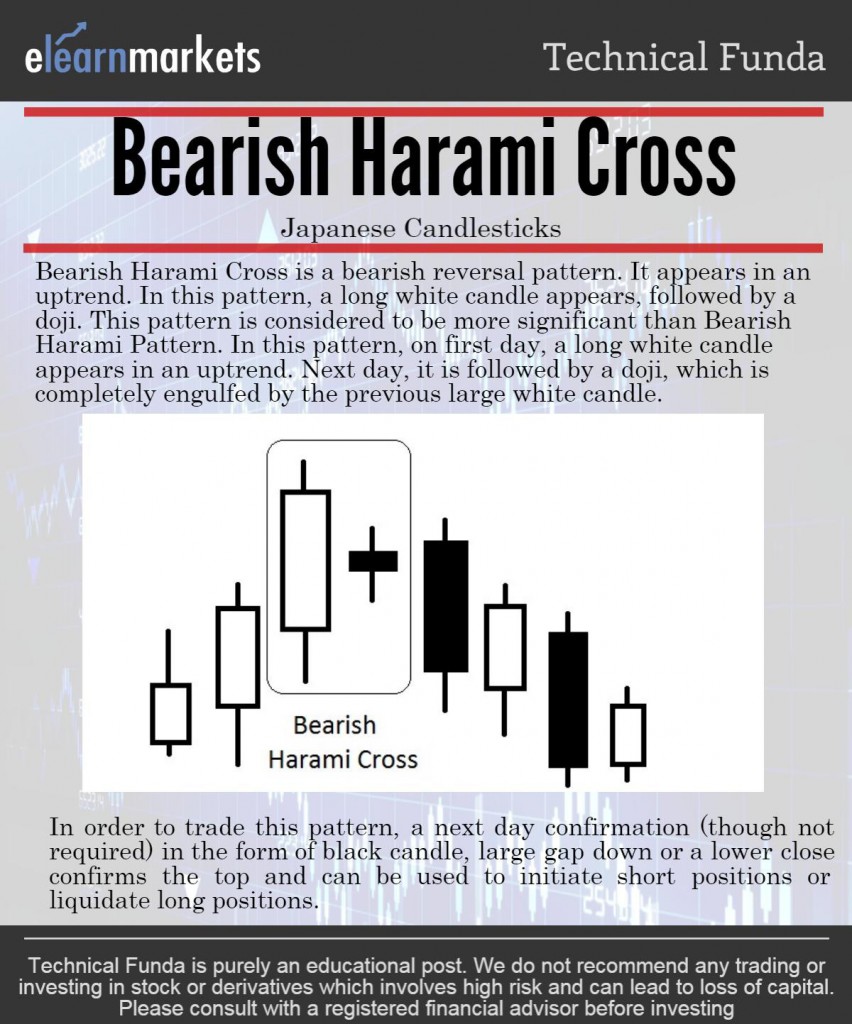
Other variations of the Harami is ‘Harami Cross’ wherein the Inside day is a small Doji candle with nearly the same open and close, in which the color is not available, and is a weak pattern as neither the bulls nor the bears could make a stand before the Inside Day closed. Refer to the gallery below for variants on HARAMI patterns.

Inside day
INSIDE DAY – the second candle is within the body of the first
INSIDE DAY: Indication of Impending Change Through Candle Sticks 1
Bullish Harami: Post a downtrend a small green/white candle forms in the body of the red/black candle
INSIDE DAY: Indication of Impending Change Through Candle Sticks 2
Bearish Harami: Post an uptrend a small red/black candle forms with the body of long green/white candle.
INSIDE DAY: Indication of Impending Change Through Candle Sticks 3
Bullish Harami cross: The small inside body has almost the same open and close , forming a cross .
INSIDE DAY: Indication of Impending Change Through Candle Sticks 4
Bearish Harami cross: The small inside body has almost the same open and close , forming a cross .

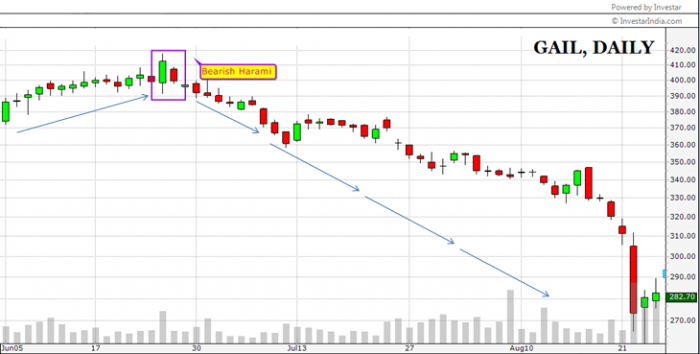
As an example of the Harami pattern, let’s look at the Daily chart of GAIL. We saw a Bearish Harami reversal after the uptrend lost steam in a series of small-bodied candles. The Trend not just reversed, It leads to very steep fall in prices.

gail daily bearish harami
GAIL daily demonstrate the Bearish Harami reversal.

Learn the technical analysis of stocks, the analysis of financial charts, trading strategies and more in our NSE Academy Certified Technical Analysis course.

In order to get the latest updates about Financial Markets visit https://stockedge.com/

Tags: candlestick analysisharami
ShareTweetSend
Get Kotak Offer Get Kotak Offer Get Kotak Offer
Previous Post

How to send a Demand Draft?

Next Post

MARKET WRAP for 09th Feb: Nifty breaks 7300 and consolidates.

Elearnmarkets

Elearnmarkets

Elearnmarkets (ELM) is a complete financial market portal where the market experts have taken the onus to spread financial education. ELM constantly experiments with new education methodologies and technologies to make financial education effective, affordable and accessible to all. You can connect with us on Twitter @elearnmarkets.

Related Posts

5 Tools to Spot Trend Reversals in Stocks 8
Technical Analysis

5 Tools to Spot Trend Reversals in Stocks

September 28, 2023
6.4k
Beginner's Guide to Trading Penny Stocks 9
Technical Analysis

Beginner’s Guide to Trading Penny Stocks

September 26, 2023
1.9k
5 Important Volatility Indicators that Traders should know 10
Technical Analysis

5 Important Volatility Indicators that Traders should know

September 19, 2023
58.5k
Top 5 Momentum Indicators that Analyses Trend Strength 11
Technical Analysis

Top 5 Momentum Indicators that Analyses Trend Strength

September 7, 2023
94.4k

Comments 5

  1. record says:
    4 years ago

    Hello to all, because I am really keen of reading this blog’s post to be updated regularly.
    It contains good material.

    Reply
  2. competition says:
    4 years ago

    I am truly glad to glance at this webpage posts which includes plenty of valuable data, thanks for
    providing such data.

    Reply
  3. แทงบอลออนไลน์ says:
    4 years ago

    Pretty! This was an incredibly wonderful article. Thank you for
    supplying these details.

    Reply
  4. seriously says:
    4 years ago

    Hi, this weekend is pleasant for me, as this
    time i am reading this impressive informative paragraph here at my residence.

    Reply
  5. shorts says:
    4 years ago

    What’s up it’s me, I am also visiting this site
    regularly, this web site is truly fastidious and the users are in fact sharing nice thoughts.

    Reply

Leave a Reply Cancel reply

Your email address will not be published. Required fields are marked *

Elearnmarkets Logo

Follow Us

Facebook-f Twitter Instagram Linkedin-in Youtube Telegram

Register on Elearnmarkets

Continue your financial learning by creating your own account on Elearnmarkets.com

Register Free Account

Download App

Playstore logo
Download on app store

Categories

  • Basic Finance
  • Derivatives
  • Financial Planning
  • Fundamental Analysis
  • Technical Analysis
  • Marketshala
  • Miscellaneous

Popular On Elearnmarkets

  • Market Superheroes:
  • Vivek Bajaj
  • Chetan Panchamia
  • Ashish Kyal
  • Premal Parekh
  • Abhijit Paul
  • Jegan
  • Sivakumar Jayachadran
  • Vishal Malkan
  • Jyoti Budhia
  • Vivek Gadodia
  • Vishal Mehta
  • Piyush Chaudhry
  • Santosh Pasi
  • Gomathi Shankar
  • Market Superheroes:
  • Vivek Bajaj
  • Chetan Panchamia
  • Ashish Kyal
  • Premal Parekh
  • Abhijit Paul
  • Jegan
  • Sivakumar Jayachadran
  • Vishal Malkan
  • Jyoti Budhia
  • Vivek Gadodia
  • Vishal Mehta
  • Piyush Chaudhry
  • Santosh Pasi
  • Gomathi Shankar
  • Courses:​
  • Options Trading
  • Dow Theory
  • Momentum Trading
  • Stock Investing
  • Stock Market for Beginners
  • Harmonic Chart Patterns
  • Algo Trading
  • Elliot Wave Theory
  • Advanced Excel
  • Cryptocurrency
  • NSE Certification Course
  • Courses:​
  • Options Trading
  • Dow Theory
  • Momentum Trading
  • Stock Investing
  • Stock Market for Beginners
  • Harmonic Chart Patterns
  • Algo Trading
  • Elliot Wave Theory
  • Advanced Excel
  • Cryptocurrency
  • NSE Certification Course
  • Webinars:
  • Bank Nifty Scalping
  • Intraday Trading Strategies
  • Options Trading Strategies
  • Options selling
  • Price Action
  • Relative Strength
  • Tax Planning
  • Options Buying
  • Growth Stocks
  • Portfolio Management
  • Relative Strength Index
  • Risk Management
  • Renko Charts
  • Crude Oil
  • Traders Psychology
  • Moving Average
  • Multibagger Stocks
  • Free Learning Modules:
  • Intraday Trading
  • Options Scalping
  • Swing Trading
  • Financial Modelling
  • RSI Indicator
  • Bollinger Bands
  • Pricing of Futures
  • Personal Finance
  • Initial Public Offerings (IPO)
  • Value Investing
  • Technical Indicators
  • Candlesticks
  • Chart Patterns
  • Option Greeks
  • ELSS Funds
  • Banking and Insurance
  • Real Estate
  • Gold
  • Book Summaries:
  • Rich Dad Poor Dad
  • Psychology of Money
  • The Intelligent Investor
  • The Richest Man in Babylon
  • Think and Trade Like a Champion
  • Value Investing and Behavioural Finance
  • Trading in the Zone
  • Learn to Earn
  • Book Summaries:
  • Rich Dad Poor Dad
  • Psychology of Money
  • The Intelligent Investor
  • The Richest Man in Babylon
  • Think and Trade Like a Champion
  • Value Investing and Behavioural Finance
  • Trading in the Zone
  • Learn to Earn
  • Tools:
  • CAGR Calculator
  • SIP Calculator
  • eLearnOptions
  • Future Value Calculator
  • Present Value Calculator
  • Atal Pension Yojana
  • Cost of Delay Calculator
  • Become a Crorepati
  • Tools:
  • CAGR Calculator
  • SIP Calculator
  • eLearnOptions
  • Future Value Calculator
  • Present Value Calculator
  • Atal Pension Yojana
  • Cost of Delay Calculator
  • Become a Crorepati

© 2023 Elearnmarkets. All Rights Reserved

  • Visit Elearnmarkets
  • Courses
  • Webinars
  • Financial Guides
  • Get Free Counselling
  • Visit Elearnmarkets
  • Courses
  • Webinars
  • Financial Guides
  • Get Free Counselling

Get Elearnmarkets App

No Result
View All Result
  • Article Categories
    • Basic Finance
    • Derivatives
    • Financial Planning
    • Fundamental Analysis
    • Technical Analysis
    • Marketshala
    • Miscellaneous
  • Language
    • Hindi
    • Bengali
    • English
  • Courses
  • Webinars
  • Stories

© 2020 Elearnmarkets All Rights Reserved

A Handbook of Technical Analysis
To start your trading journey as a seasoned technical analyst
Download Now
View Details
View Course Details
Guidebook On Chart Patterns
Take Your Trading To The Next Level With Strategies Shared In This Ebook
Download Now