According to Wikipedia, Causality (also referred to as causation, or cause and effect) is the agency or efficacy that connects one process (the cause) with another process or state (the effect), where the first is understood to be partly responsible for the second, and the second is dependent on the first.
In general, a process has many causes, which are said to be the causal factors for it, and all lie in its past. An effect can, in turn, be a cause of many other effects. You must be thinking that why I am saying all these things. Right? It is just to increase your curiosity. You will soon be able to relate to it.
Let us discuss the MACD indicator strategy and histogram. I know being a chartist you are familiar with this tool.
Hence I hope this will be a revision for you. Assuming you already know this topic, you should know that MACD Histogram is derived from MACD.
To me, it is the effect of MACD (cause), without which MACD Histogram would not have been born. I hope you can relate it to the previous paragraph. If not, no problem. Carry on reading.
But before proceeding further I would request you to recapitulate MACD (moving average convergence divergence). Thanks for converging your thoughts with that of mine. I am glad. It will help me to explain this article without taking the additional burden.
What is MACD Histogram ?
MACD Histogram was developed in 1986 by Thomas Aspray. It bridges the time gap between the price movement and MACD. It also offers a deeper insight into the balance of power between so-called bulls and bears than the original MACD.
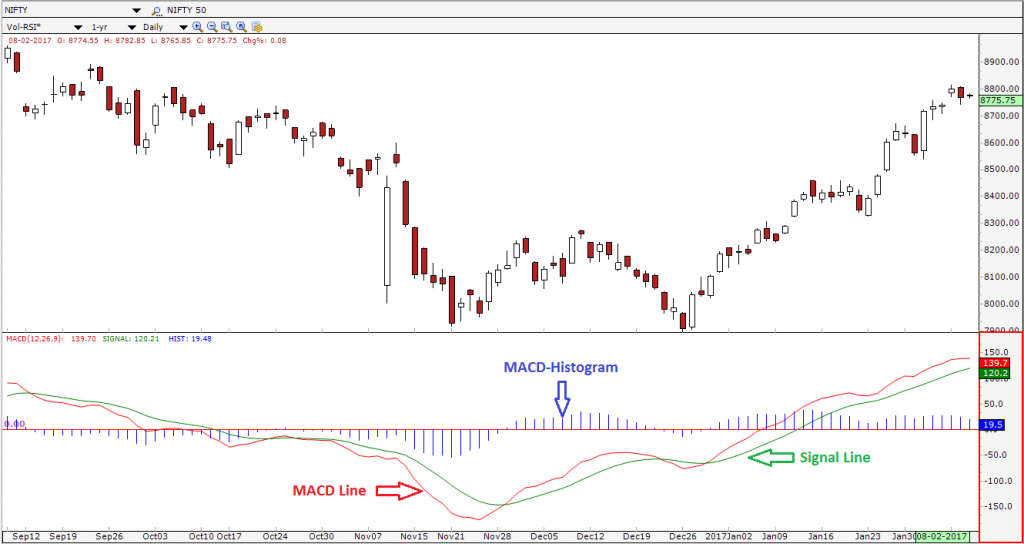
The histogram is one of the best tools available to a chartist because it shows not only who has control over the market but also their magnitude of strength and provides a MACD trading strategy that works. It measures the distance between MACD and its Signal Line which is obviously the 9 day EMA of MACD, i.e.,
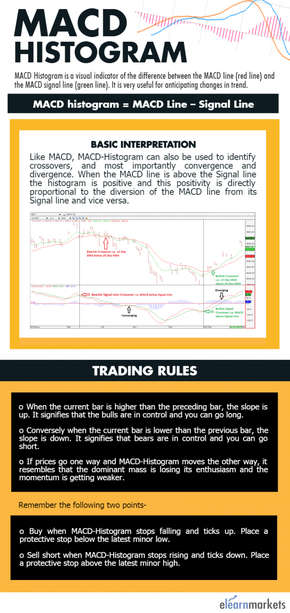
MACD Histogram = MACD Line – Signal Line
The difference is represented by vertical lines in a series. The interesting fact is that like MACD, MACD-Histogram also fluctuates above and below the zero line. Hence, it is also known as an “oscillator”. In other words, it is just the hide and seeks between the fast and slow lines.
Let me clarify the mystery of the chemistry between the two lines. Though I know you are very much efficient at doing that yourself, I intend to advertise my knowledge. Haha!
If the fast line is above the slow line, MACD-Histogram is positive and plotted above the zero line. On the other hand, if the fast line is below the slow line, MACD-Histogram is negative and plotted below the zero line. Interestingly when the two lines touch, MACD Histogram equals zero. The magnitude of height is directly proportional to the spread between the MACD and Signal Line.
In layman’s terms when the spread increases MACD-Histogram becomes taller or deeper, depending on its direction. When the opposite scenario occurs, i.e., when the two lines draw closer, MACD-Histogram becomes shorter. You will get the maximum benefit when you will be able to identify the real value of the histogram. Don’t get confused. I just wanted to mean, spotting, when the spread between the two lines is widening or narrowing.
The chemistry is when the histogram is over its zero line, i.e., positive, but starts to fall toward the zero line, it signifies the uptrend is weakening. Conversely, when the histogram is below its zero line, i.e., negative, but starts to rise toward the zero line, it signifies the downtrend is weakening. In other words, the decrease in height when above and below the zero line signifies that the underlying momentum is getting weaker.
It just gives a warning but never provides a signal to go long or short.
Learn about Divergence truths & Myths in just 2 hours by Market Experts
According to the bookish way you should wait until the histogram crosses, it’s zero line. But if you are an expert you can make your own formula. It’s an earnest request, never break your trade. At first plan your trade and then trade your plan. In my early days as a chartist when I just started to learn these steps, I was stunned.
Why?
To me, it was a mind-boggling fact that the turns in the histogram back toward the zero line always preceded the actual crossover signals. These turns are the best for spotting early exist signals from your existing positions. The other scenario is obviously dangerous. It is applicable only to experts.
A Marriage of weekly and daily
You must have your own trading system which best suits you.
If not then I would suggest you follow a step blindly. Yes, blindly. Maintain two different time frames. One for identification and another for execution. Yes, look at the greater time frame and execute your trade on the smaller time frame.
The only reason behind it is weekly signals are more important than those on daily charts. MACD Histogram works well in this formula.
The best way to combine them is to use weekly signals to determine market direction and the daily signals to fine-tune entry and exit points.
Also Read: Interpretation of MACD Indicator
Usually, if the weekly chart gives you a trigger then the shorter time frame also gets sync with its larger slice.
Don’t have to follow my words blindly. An empirical study will prove my preceding statement. Experience it and give your reviews. It really acts as a scanner that filters for daily signals.
Benefits of Contrary thinking
It’s really an out-of-the-box idea.
Basically, the principle of Contrary Opinion holds that when the vast majority of people agree on anything, they are generally wrong. I want to add a maxim to increase its weightage “Don’t do different things, but do things differently”.
It will surely help you to increase the size of your portfolio returns. Act as a contrarian. First, try to determine what the mass is doing and then act accordingly in the opposite direction to reap the benefits. It is advisable only for those who don’t want to converge their thought process with crowd psychology.
Common Psychology in MACD Histogram
MACD histogram depicts the difference between long-term and short-term consensus. By now you must have gained some knowledge of both MACD and MACD Histogram.
Then you must have understood that if you consider a shorter time frame then the fast MACD line reflects market consensus.
On the other hand, if someone considers a longer time frame then the slow Signal line reflects market consensus.
So, what is the role of MACD-Histogram? It simply fills the gap between these two lines.
Incorporating the MACD trading strategies into your investment approach can offer valuable insights into market trends, empowering you to make informed decisions and potentially optimize your returns. Learn more about how to implement the MACD trading strategy effectively here.
MACD Histogram Basic Interpretations:
Being the fourth derivative of price, MACD-Histogram plays an important role. Hence, let’s go on to interpret this indicator
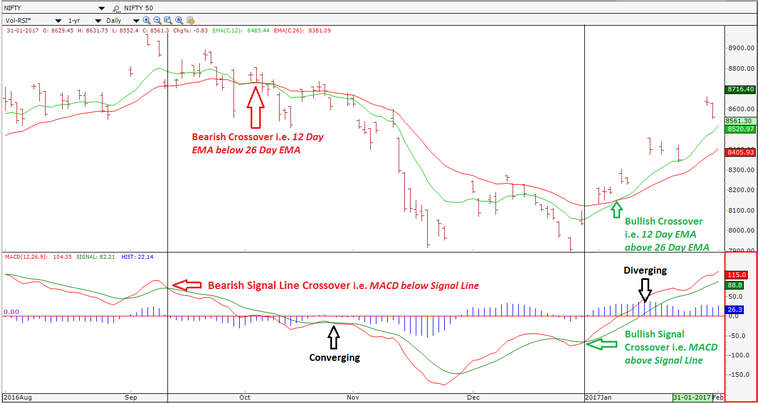
Like MACD, MACD-Histogram can also be used to identify crossovers, and most importantly convergences and divergences.
As described earlier when the MACD line is above the Signal line the histogram is positive and this positivity is directly proportional to the diversion of the MACD line from its Signal line.

On the other hand, when the MACD line is below the Signal line the histogram is negative and this negativity is directly proportional to the diversion of the MACD line from its Signal line.
In both cases, the magnitude decreases when the MACD line and the Signal line converge.
It’s good to see your concentration level. After all, where focus goes, energy flows.
Okay, let me elaborate on the divergence factor a bit…
MACD Histogram Peak-Trough Divergence
By now you must have understood how the histogram dances to the tunes of prices. If one looks at it closely then one can easily identify the divergences.
You will notice that a peak and trough divergence is formed with two peaks or two troughs in the MACD Histogram.
Usually, it can be segregated into two parts, i.e. bullish peak and trough divergence and bearish peak and trough divergence.
Alright, I will explain you in short.
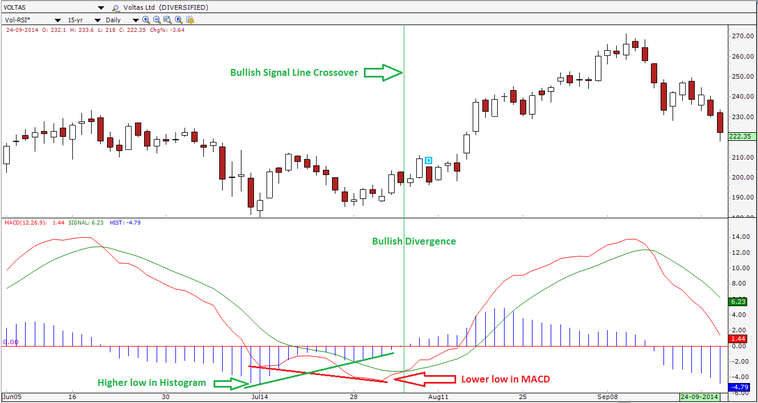
Bullish Peak-Trough Divergence
It is formed when MACD makes a lower low and on the contrary, MACD-Histogram makes a higher low. One thing you should keep in mind, i.e., well-defined troughs define the health of a bullish peak-trough divergence.
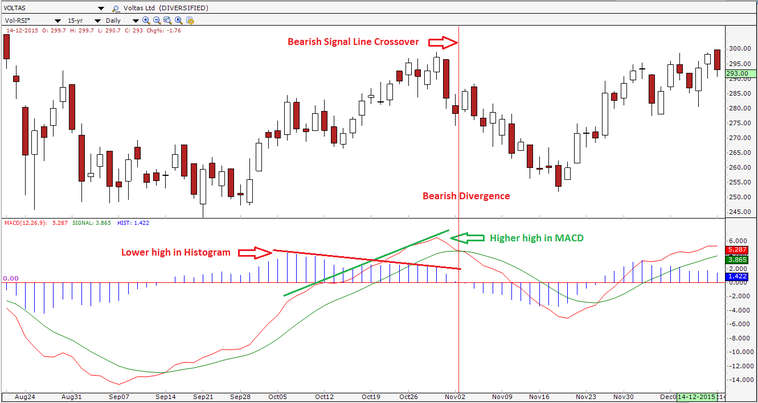
Bearish Peak-Trough Divergence
It is formed when MACD makes a higher high and on the contrary MACD Histogram makes a lower high.
One thing you should keep in mind, i.e., well-defined peaks define the health of a bearish peak-trough divergence.
N.B. – Well, defined peaks/troughs are an important parameter to judge the health of divergence. Moreover, another thing which you definitely is that the divergence gives a signal prior to the crossover.
Without further circumlocution let me describe Slant Divergence in short.
Learn from Experts : Advanced Technical Analysis Course
MACD Histogram Slant Divergence
As the name suggests, slant divergence, in other words, is a slope that is capable of creating a divergence without well-defined peaks/troughs. Hence, it is easily visible. Instead of two peaks/troughs, there is only one slope.
For our convenience, we can name it as a bullish or upward slant and a bearish or downward slant.
As of now, you must have understood that as the MACD Line crosses the Signal Line from above, the price level falls, and simultaneously the histogram is visible on the downside, i.e., below the zero line.
On the other hand, when the MACD Line crosses the Signal Line from below, the price level rises, and simultaneously the histogram is visible on the upside, i.e., above the zero line. Enough of recapitulation. Let’s proceed.
Bullish/Upward slant
The MACD Line moves downward and makes a lower low. On the contrary the histogram contracts on the downside and moves towards the zero line, which leads to an upward slant.
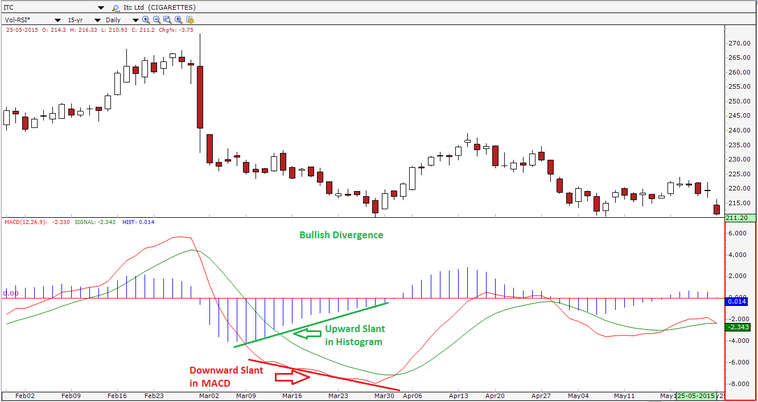
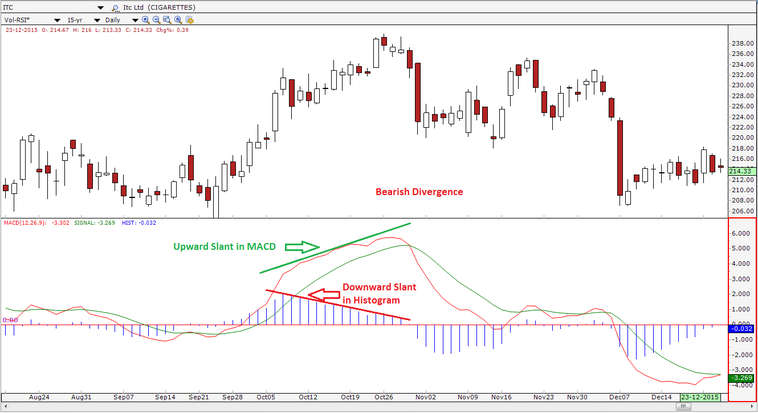
Bearish/Downward slant
The MACD Line moves upward and makes a higher high. On the contrary the histogram contracts on the upside and moves towards the zero line, which leads to a downward slant.
N.B.-. This slant towards the zero line reflects a convergence between MACD and its Signal Line.
The underlying momentum strength is directly proportional to the distance between the MACD and its Signal Line.
I hope you can predict my thought process. Yes, you are right.
In other words, the underlying momentum is directly proportional to the MACD Histogram.
Any contraction in the histogram is not only a signal of weakness in momentum but also the first step towards a signal line crossover.
MACD Histogram Trading Rules
Usually, two types of trading signals are given by MACD Histogram.
According to Alexander Elder, one is common and occurs at every price bar whereas the other is rare and occurs only a few times a year in any market – but it is extremely strong.
Also Read: Triple screen trading system: the Alexander Elder way of trading
From the slope of the MACD Histogram, one can get the most common signal.
When the current bar is higher than the preceding bar, the slope is up. It signifies that the bulls are in control and you can go long.
Conversely, when the current bar is lower than the previous bar, the slope is down. It signifies that bears are in control and you can go short.
If prices go one way and MACD-Histogram moves the other way, it resembles that the dominant mass is losing its enthusiasm and the momentum is getting weaker as I have described earlier.
Remember the following two points-
- Buy when MACD Histogram stops falling and ticks up. Place a protective stop below the latest minor low.
- Sell short when MACD Histogram stops rising and ticks down. Place a protective stop above the latest minor high.
Note: On smaller time frames say hourly or daily the tick-tick of MACD –Histogram is very frequent. Right? I hope you have noticed that it ticks up and down so often, that, it is not practical to go long and short every time it turns.
The slope acts well in a longer time frame say weekly. On weekly charts, it is more meaningful.
Bottomline:
It is always better to use a mix of technical indicators, instead of a single indicator for making better trading decisions. To analyze your trade, you should go for the best trading app that can give you proper analytics for tracking. Some of the concepts mentioned in this article are the results of my speculation based on the theories of Dr. Alexander Elder and John J. Murphy. I hope you got some clarity on “MACD Histogram”.


Thank you for this article! Very helpful and also entertaining. I appreciate it.
Hi June ,
Thank you for reading!
You can more blogs on Technical Analysis here.
Keep Reading!
I liked it, very clarifying.Thank you.
Hi Ruben,
Thank you for reading!
You can more blogs on Technical Analysis here.
Keep Reading!
Thanks for the knowledge, but can you explain with example more about below 2 points
Remember the following two points-
a. Buy when MACD Histogram stops falling and ticks up. Place a protective stop below the latest minor low.
b. Sell short when MACD Histogram stops rising and ticks down. Place a protective stop above the latest minor high.
Hi Dini,
These are rules of MACD Histogram while doing technical analysis with this technique.
Thank you for Reading!
Keep Reading!
thank u so much. knowledgeable article sir, thank u so much
Hi,
Thank you for Reading!
Keep Reading!
Keep functioning ,remarkable job!
Thank you so much for the effort you have exert to explained and illustrate this indicator.
Hi,
Thank you for reading our blog!
Keep Reading!!
It’s lovely sir. I think I went through Elder and Murphy MACD histogram analysis by reading your analysis. Thanks for your presentation
thank you so much
Thank you for this article it was helpful
Hi,
Thank you for reading our blog!!
Keep Reading!
The movement of the bar chart caught my attention, an I have to studying ways to take advantage of it. I am a beginner. I have to do very well to study this write up
Thanks
Hi,
We really appreciated that you liked our blog.
Keep Reading!