Elearnmarkets - Financial Market Learning
  • Categories
    • Basic Finance
    • Derivatives
    • Financial Planning
    • Fundamental Analysis
    • Technical Analysis
    • Marketshala
    • Miscellaneous
  • Language
    • English
    • Hindi
    • Bengali
No Result
View All Result
  • Courses
  • Webinars
  • Learn On Elearnmarkets
Elearnmarkets - Learn Stock Market, trading, investing for Free
No Result
View All Result
Home Technical Analysis Charts, Patterns & Indicators
Symmetrical Triangle

Symmetrical Triangle

Symmetrical Triangle / Coil pattern / Isoceles Triangle

Elearnmarkets by Elearnmarkets
November 19, 2021
in Charts, Patterns & Indicators, Technical Analysis
Reading Time: 2 mins read
2
2k
VIEWS
Share on FacebookShare on TwitterShare on WhatsApp


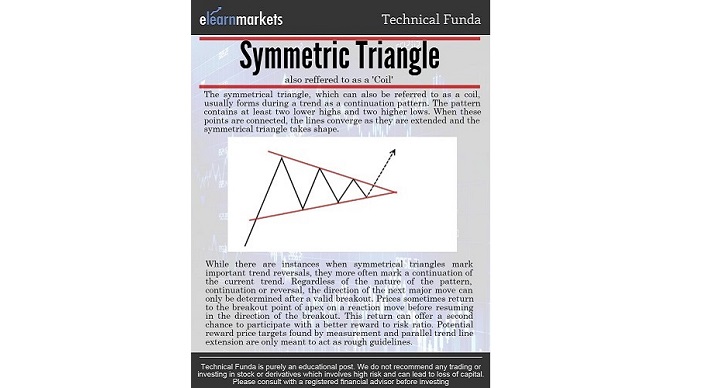
What is a Symmetrical Triangle?

 Symmetrical Triangle
Symmetrical Triangle

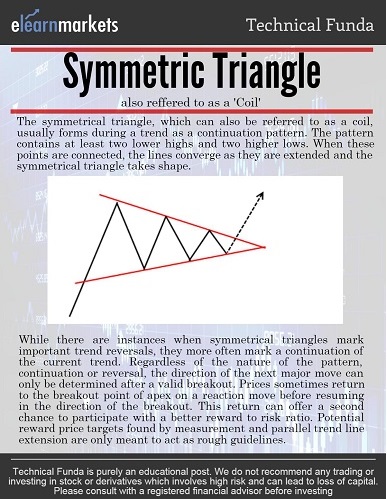
A symmetrical triangle is a technical chart pattern,  formed by the fluctuations in price movements.

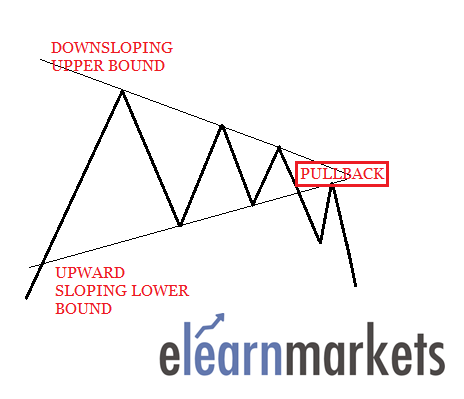
The upper and the lower bounding lines converge to finally cross each other at the ‘Apex’.

A symmetrical triangle is also known as the ‘Coil’ or ‘Isosceles Triangle’ because of its appearance.

This pattern can have some 5-7 touch points on the bounds before breaking out in either direction.

Predicting the direction of breakout is not an easy task as there may be false breakouts and other parameters need to be focused upon when studying this pattern.


Join TMP Join TMP Join TMP

Also Read: Master Pitchfork channel to improve your trading experience

For example, Volumes – Falling volumes during the formation of a symmetrical triangle is a favorable sign and high volumes on breakout agree that the price will continue in the direction of the breakout.

This pattern is often a victim of ‘Pullback’ and ‘Throwbacks’.

Know More:  How to trade Megaphone Pattern?

The reason I call it victim is to engrave in your mind that pullbacks and throwbacks tend to reduce the performance of the symmetrical pattern.

There need to be proper breakout rules out of this pattern.

Like, consider only the breakouts which occur on a closing basis, not intraday spikes out of the bounds.

PULLBACK
PULLBACK


THROWBACK
THROWBACK

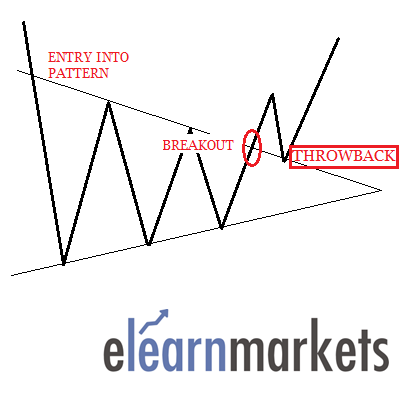
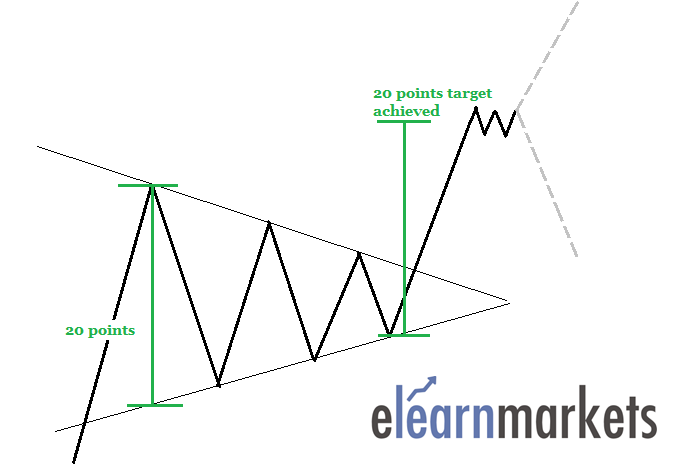
The target for the symmetrical triangle is decided by add the width of the broadest part of the triangle, that is the base, to the lower bound at the point of breakout.

However, as we mentioned above, on a  throwback (prices falling back to the upper bound post breakout) or a pullback (prices treading up to touch the lower bound of the pattern) the target gets diminished by the amount of price movement constituted in the action.

SYMMETRICAL TRIANGLE
SYMMETRICAL TRIANGLE target calculation method

For traders, having a technical chart pattern is a key part of technical analysis. Enroll for NSE Academy Certified Technical Analysis course on Elearnmarkets.

Bottomline:

A symmetrical triangle is one of several technical chart patterns.

We hope that this write up helped you to understand Symmetrical Triangle Patterns in a better manner.

Feel free to give your feedback to us by writing in the comment box below.

In order to get the latest updates on Financial Markets visit stockedge

Tags: advancecoilenglish
ShareTweetSend
Previous Post

MARKET WRAP for 17th Feb, 2016: Nifty bounced in the last hours, sectors remain sluggish, Just dial rallies 19%

Next Post

Kaveri Seed sprouting in the bounds of a Symmetrical Triangle

Elearnmarkets

Elearnmarkets

Elearnmarkets (ELM) is a complete financial market portal where the market experts have taken the onus to spread financial education. ELM constantly experiments with new education methodologies and technologies to make financial education effective, affordable and accessible to all. You can connect with us on Twitter @elearnmarkets.

Related Posts

Technical Analysis in Stock Trading 1
Technical Analysis

Technical Analysis in Stock Trading

May 31, 2023
5.7k
The Ultimate guide to Trading Divergences 2
Technical Analysis

The Ultimate guide to Trading Divergences

May 26, 2023
932
Trading Psychology: Guide to Master Your Mind in 5 Steps 3
Technical Analysis

Trading Psychology: Guide to Master Your Mind in 5 Steps

May 24, 2023
2.9k
Trading Psychology: 7 Keys to Successful Trading 4
Technical Analysis

Trading Psychology: 7 Keys to Successful Trading

May 22, 2023
2.9k

Comments 2

  1. Brian Rose says:
    1 year ago

    Hi, would you be interested in coming onto my YouTube (London Real) channel to discuss this further?

    Reply
    • Sakshi Agarwal says:
      1 year ago

      Hi,

      We really appreciated that you liked our blog! Thank you for your feedback!

      Keep Reading!

      Reply

Leave a Reply Cancel reply

Your email address will not be published. Required fields are marked *

Follow Us

Facebook-f Twitter Instagram Linkedin-in Youtube Telegram

Register on Elearnmarkets

Continue your financial learning by creating your own account on Elearnmarkets.com

Register Free Account

Download App

Categories

  • Basic Finance
  • Derivatives
  • Financial Planning
  • Fundamental Analysis
  • Technical Analysis
  • Marketshala
  • Miscellaneous

Popular On Elearnmarkets

  • Market Superheroes:
  • Vivek Bajaj
  • Chetan Panchamia
  • Ashish Kyal
  • Premal Parekh
  • Abhijit Paul
  • Jegan
  • Sivakumar Jayachadran
  • Vishal Malkan
  • Jyoti Budhia
  • Vivek Gadodia
  • Vishal Mehta
  • Piyush Chaudhry
  • Santosh Pasi
  • Gomathi Shankar
  • Market Superheroes:
  • Vivek Bajaj
  • Chetan Panchamia
  • Ashish Kyal
  • Premal Parekh
  • Abhijit Paul
  • Jegan
  • Sivakumar Jayachadran
  • Vishal Malkan
  • Jyoti Budhia
  • Vivek Gadodia
  • Vishal Mehta
  • Piyush Chaudhry
  • Santosh Pasi
  • Gomathi Shankar
  • Courses:​
  • Options Trading
  • Dow Theory
  • Momentum Trading
  • Stock Investing
  • Stock Market for Beginners
  • Harmonic Chart Patterns
  • Algo Trading
  • Elliot Wave Theory
  • Advanced Excel
  • Cryptocurrency
  • NSE Certification Course
  • Courses:​
  • Options Trading
  • Dow Theory
  • Momentum Trading
  • Stock Investing
  • Stock Market for Beginners
  • Harmonic Chart Patterns
  • Algo Trading
  • Elliot Wave Theory
  • Advanced Excel
  • Cryptocurrency
  • NSE Certification Course
  • Webinars:
  • Bank Nifty Scalping
  • Intraday Trading Strategies
  • Options Trading Strategies
  • Options selling
  • Price Action
  • Relative Strength
  • Tax Planning
  • Options Buying
  • Growth Stocks
  • Portfolio Management
  • Relative Strength Index
  • Risk Management
  • Renko Charts
  • Crude Oil
  • Traders Psychology
  • Moving Average
  • Multibagger Stocks
  • Free Learning Modules:
  • Intraday Trading
  • Options Scalping
  • Swing Trading
  • Financial Modelling
  • RSI Indicator
  • Bollinger Bands
  • Pricing of Futures
  • Personal Finance
  • Initial Public Offerings (IPO)
  • Value Investing
  • Technical Indicators
  • Candlesticks
  • Chart Patterns
  • Option Greeks
  • ELSS Funds
  • Banking and Insurance
  • Real Estate
  • Gold
  • Book Summaries:
  • Rich Dad Poor Dad
  • Psychology of Money
  • The Intelligent Investor
  • The Richest Man in Babylon
  • Think and Trade Like a Champion
  • Value Investing and Behavioural Finance
  • Trading in the Zone
  • Learn to Earn
  • Book Summaries:
  • Rich Dad Poor Dad
  • Psychology of Money
  • The Intelligent Investor
  • The Richest Man in Babylon
  • Think and Trade Like a Champion
  • Value Investing and Behavioural Finance
  • Trading in the Zone
  • Learn to Earn
  • Tools:
  • CAGR Calculator
  • SIP Calculator
  • eLearnOptions
  • Future Value Calculator
  • Present Value Calculator
  • Atal Pension Yojana
  • Cost of Delay Calculator
  • Become a Crorepati
  • Tools:
  • CAGR Calculator
  • SIP Calculator
  • eLearnOptions
  • Future Value Calculator
  • Present Value Calculator
  • Atal Pension Yojana
  • Cost of Delay Calculator
  • Become a Crorepati

© 2023 Elearnmarkets. All Rights Reserved

  • Visit Elearnmarkets
  • Courses
  • Webinars
  • Financial Guides
  • Get Free Counselling
  • Visit Elearnmarkets
  • Courses
  • Webinars
  • Financial Guides
  • Get Free Counselling

Get Elearnmarkets App

No Result
View All Result
  • Article Categories
    • Basic Finance
    • Derivatives
    • Financial Planning
    • Fundamental Analysis
    • Technical Analysis
    • Marketshala
    • Miscellaneous
  • Language
    • Hindi
    • Bengali
    • English
  • Courses
  • Webinars

© 2020 Elearnmarkets All Rights Reserved