Elearnmarkets - Financial Market Learning
  • Categories
    • Basic Finance
    • Derivatives
      • Futures
      • Options
    • Financial Planning
    • Fundamental Analysis
    • Technical Analysis
    • Marketshala
    • Miscellaneous
  • Language
    • English
    • Hindi
    • Bengali
No Result
View All Result
  • Courses
  • Webinars
  • Stories
Elearnmarkets - Learn Stock Market, trading, investing for Free
No Result
View All Result
Home Fundamental Analysis
Nifty P/E Ratio - An Indicator of Stock Market Health 1

Nifty P/E Ratio – An Indicator of Stock Market Health

Elearnmarkets by Elearnmarkets
August 22, 2023
in Fundamental Analysis
Reading Time: 5 mins read
2
6.7k
VIEWS
Share on FacebookShare on XShare on WhatsApp

Listen to this:

The nifty P/E ratio works the same as individual stocks’ Price to Earnings Ratio. It measures the average P/E ratio of the Nifty 50 companies. It is one of the simple but very helpful buy/sell indicators for all investors who believe in buying good companies at throwaway prices.

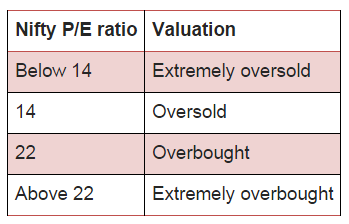
Nifty is considered in the overbought zone when Nifty P/E is trading at or above 22, and anything below 14 is considered undervalued.

Table Of Contents
  1. What is PE Ratio?
  2. What is the PE Ratio of Nifty?
    • Learn about Nifty Intraday Strategy in 2 hours by Market Experts
  3. Bottomline

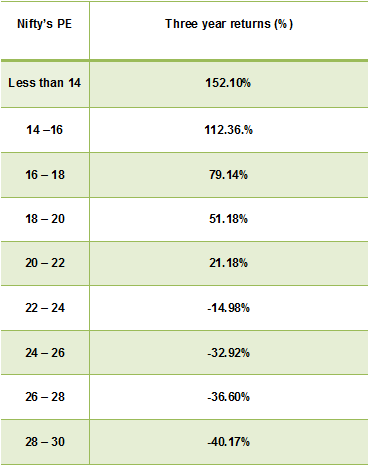
Professor Sanjay Bakshi, a renowned value Investor said – “Recent research done by my firm shows just how dangerous it is to remain invested in an expensive market. Since NSE started, every time when Nifty’s Price/Earnings ratio exceeded 22, the average return from Indian equities over the subsequent three years became negative”

Nifty P/E Ratio and 3 Year Returns

What is PE Ratio?

Ideally, long-term investors who believe in value investing usually buy stocks when P/E reaches 14 or below and avoid buying when P/E goes above 22.

To determine the P/E value, one must simply divide the current stock price by the earnings per share (EPS).

The current stock price (P) can be found simply by plugging a stock’s ticker symbol into any finance website, and although this concrete value reflects what investors must currently pay for a stock, the EPS is slightly more nebulous figure.

So, what is a good PE ratio for a stock? A “good” P/E ratio isn’t necessarily a high ratio or a low ratio on its own. The market average P/E ratio currently ranges from 20-25, so a higher PE above that could be considered bad, while a lower PE ratio could be considered better.

The two types of EPS metrics factor into the most common types of P/E ratios: the forward P/E and the trailing P/E. A third and less common variation uses the sum of the last two actual quarters and the estimates of the next two quarters.

The forward (or leading) P/E uses future earnings guidance rather than trailing figures. Sometimes called “estimated price to earnings,” this forward-looking indicator is useful for comparing current earnings to future earnings and helps provide a clearer picture of what earnings will look like—without changes and other accounting adjustments.

RelatedPosts

Everything you should know about Dividend Investing 2

Everything you should know about Dividend Investing

September 14, 2023
4.9k
7 rules of Growth Investing 3

7 rules of Growth Investing

September 13, 2023
3.9k
A Comprehensive Guide: 4 Ways to Pick Best Stocks for Long Term Investments 4

A Comprehensive Guide: 4 Ways to Pick Best Stocks for Long Term Investments

August 7, 2023
5.3k

What is the PE Ratio of Nifty?

The table below gives a brief idea about the P/E-based valuation.

Nifty P/E Ratio and valuation

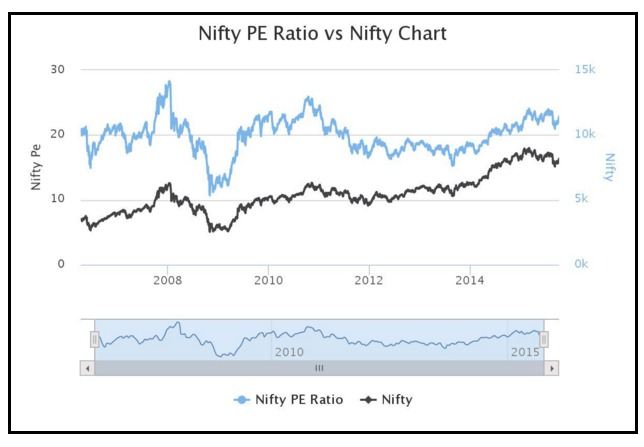
Nifty P/E ratio on 08-10-2015 is trading at 22.71 whereas Nifty closed at 8129.35.

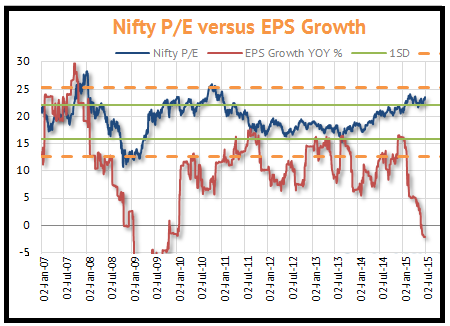
Currently, the market is trading at an extremely overbought area which shows that price is moving at a faster rate with respect to its earning.

Learn about Nifty Intraday Strategy in 2 hours by Market Experts

Previous two times when Nifty crossed P/E of 22, the earnings growth was strong,  following the trend of P/E. However, the scenario is not the same this time since earning is coming down while P/E is still heading up i.e contradictory.

Also Read: A quick introduction to the term index and its concepts

This shows the market has moved up just in the hope of optimism, but the reality is completely different.

Nifty PE ratio vs EPS growth

History says that whenever Nifty goes above 22 P/E, the market sees a correction. It would be important to see what happens this time?

It is usually seen that most of the money comes into mutual funds when Nifty is in the overbought zone and very few people invest in the oversold region.

Though in reality, it should be opposite, thus reflecting the psychology of herding mentality.

Nifty P/E ratio vs Nifty Chart

Bottomline

However, with the huge optimism built on the Modi government, the market has already rallied much. Let’s see, whether the government will be able to deliver the result and if so, then the market may continue to rally further.

Feel free to give your feedback by writing in the comment box below.

In order to get the latest updates on Financial Markets visit StockEdge

Happy Investing!

Tags: englishintermediateniftyNifty P/E
ShareTweetSend
Get Kotak Offer Get Kotak Offer Get Kotak Offer
Previous Post

Why Elearnmarkets is a revolution in online Financial Literacy

Next Post

Holding Cash- an important decision

Elearnmarkets

Elearnmarkets

Elearnmarkets (ELM) is a complete financial market portal where the market experts have taken the onus to spread financial education. ELM constantly experiments with new education methodologies and technologies to make financial education effective, affordable and accessible to all. You can connect with us on Twitter @elearnmarkets.

Related Posts

Everything you should know about Dividend Investing 5
Fundamental Analysis

Everything you should know about Dividend Investing

September 14, 2023
4.9k
7 rules of Growth Investing 6
Fundamental Analysis

7 rules of Growth Investing

September 13, 2023
3.9k
A Comprehensive Guide: 4 Ways to Pick Best Stocks for Long Term Investments 7
Fundamental Analysis

A Comprehensive Guide: 4 Ways to Pick Best Stocks for Long Term Investments

August 7, 2023
5.3k
Business Models - Example, Types, Importance & Advantages 8
Fundamental Analysis

Business Models – Example, Types, Importance & Advantages

September 4, 2023
139.8k

Comments 2

  1. Aamir Sheikh says:
    7 years ago

    A well-written writeup on Nifty P/E ratio which plays a key role in determining the overall valuations of the stock market.

    Reply
  2. Ankit jaiswal says:
    7 years ago

    Thanks Aamir!
    I totally agree with you.

    Reply

Leave a Reply Cancel reply

Your email address will not be published. Required fields are marked *

Elearnmarkets Logo

Follow Us

Facebook-f Twitter Instagram Linkedin-in Youtube Telegram

Register on Elearnmarkets

Continue your financial learning by creating your own account on Elearnmarkets.com

Register Free Account

Download App

Playstore logo
Download on app store

Categories

  • Basic Finance
  • Derivatives
  • Financial Planning
  • Fundamental Analysis
  • Technical Analysis
  • Marketshala
  • Miscellaneous

Popular On Elearnmarkets

  • Market Superheroes:
  • Vivek Bajaj
  • Chetan Panchamia
  • Ashish Kyal
  • Premal Parekh
  • Abhijit Paul
  • Jegan
  • Sivakumar Jayachadran
  • Vishal Malkan
  • Jyoti Budhia
  • Vivek Gadodia
  • Vishal Mehta
  • Piyush Chaudhry
  • Santosh Pasi
  • Gomathi Shankar
  • Market Superheroes:
  • Vivek Bajaj
  • Chetan Panchamia
  • Ashish Kyal
  • Premal Parekh
  • Abhijit Paul
  • Jegan
  • Sivakumar Jayachadran
  • Vishal Malkan
  • Jyoti Budhia
  • Vivek Gadodia
  • Vishal Mehta
  • Piyush Chaudhry
  • Santosh Pasi
  • Gomathi Shankar
  • Courses:​
  • Options Trading
  • Dow Theory
  • Momentum Trading
  • Stock Investing
  • Stock Market for Beginners
  • Harmonic Chart Patterns
  • Algo Trading
  • Elliot Wave Theory
  • Advanced Excel
  • Cryptocurrency
  • NSE Certification Course
  • Courses:​
  • Options Trading
  • Dow Theory
  • Momentum Trading
  • Stock Investing
  • Stock Market for Beginners
  • Harmonic Chart Patterns
  • Algo Trading
  • Elliot Wave Theory
  • Advanced Excel
  • Cryptocurrency
  • NSE Certification Course
  • Webinars:
  • Bank Nifty Scalping
  • Intraday Trading Strategies
  • Options Trading Strategies
  • Options selling
  • Price Action
  • Relative Strength
  • Tax Planning
  • Options Buying
  • Growth Stocks
  • Portfolio Management
  • Relative Strength Index
  • Risk Management
  • Renko Charts
  • Crude Oil
  • Traders Psychology
  • Moving Average
  • Multibagger Stocks
  • Free Learning Modules:
  • Intraday Trading
  • Options Scalping
  • Swing Trading
  • Financial Modelling
  • RSI Indicator
  • Bollinger Bands
  • Pricing of Futures
  • Personal Finance
  • Initial Public Offerings (IPO)
  • Value Investing
  • Technical Indicators
  • Candlesticks
  • Chart Patterns
  • Option Greeks
  • ELSS Funds
  • Banking and Insurance
  • Real Estate
  • Gold
  • Book Summaries:
  • Rich Dad Poor Dad
  • Psychology of Money
  • The Intelligent Investor
  • The Richest Man in Babylon
  • Think and Trade Like a Champion
  • Value Investing and Behavioural Finance
  • Trading in the Zone
  • Learn to Earn
  • Book Summaries:
  • Rich Dad Poor Dad
  • Psychology of Money
  • The Intelligent Investor
  • The Richest Man in Babylon
  • Think and Trade Like a Champion
  • Value Investing and Behavioural Finance
  • Trading in the Zone
  • Learn to Earn
  • Tools:
  • CAGR Calculator
  • SIP Calculator
  • eLearnOptions
  • Future Value Calculator
  • Present Value Calculator
  • Atal Pension Yojana
  • Cost of Delay Calculator
  • Become a Crorepati
  • Tools:
  • CAGR Calculator
  • SIP Calculator
  • eLearnOptions
  • Future Value Calculator
  • Present Value Calculator
  • Atal Pension Yojana
  • Cost of Delay Calculator
  • Become a Crorepati

© 2023 Elearnmarkets. All Rights Reserved

  • Visit Elearnmarkets
  • Courses
  • Webinars
  • Financial Guides
  • Get Free Counselling
  • Visit Elearnmarkets
  • Courses
  • Webinars
  • Financial Guides
  • Get Free Counselling

Get Elearnmarkets App

No Result
View All Result
  • Article Categories
    • Basic Finance
    • Derivatives
    • Financial Planning
    • Fundamental Analysis
    • Technical Analysis
    • Marketshala
    • Miscellaneous
  • Language
    • Hindi
    • Bengali
    • English
  • Courses
  • Webinars
  • Stories

© 2020 Elearnmarkets All Rights Reserved