Nifty (Close approx. 9978.55): The market fell on Tuesday due to an unexpected regulatory order imposing trading restrictions on 331 listed entities identified as shell companies raised concerns about a wider probe into others.
In today’s session, Nifty was down by 78.85 points and the market took support at 20 DMA (presently at approx 9970.1) in the daily time frame.
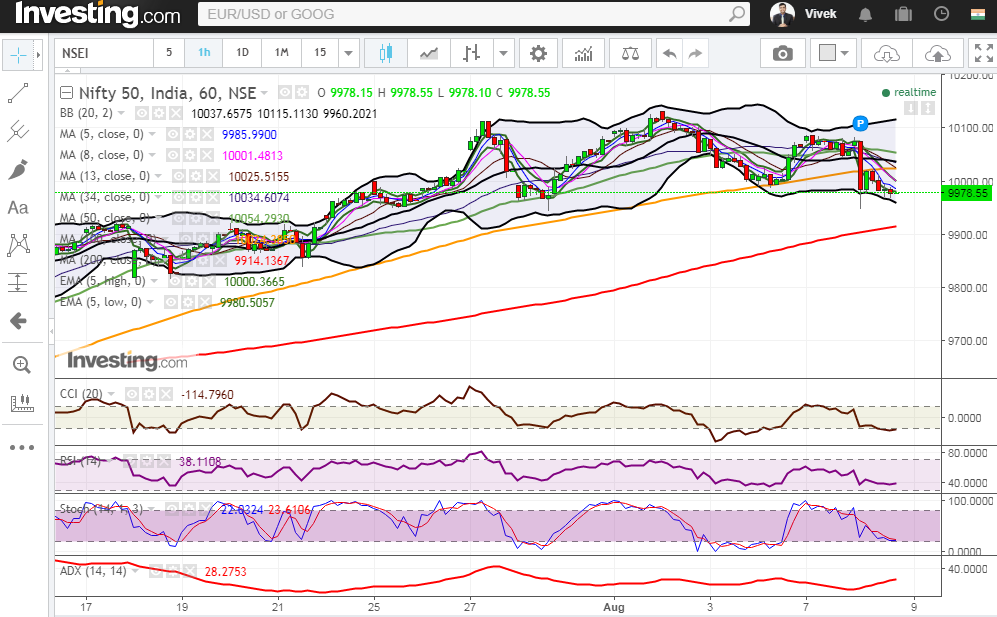
Hourly Technical:
The market erased opening gains and slipped more than 100 points in the very first hour. It bounced from its lows but faced strong resistance at the 100 hourly moving average (presently at approx 10024.4) and again started correcting.
At present the market is below most short term moving averages and the next probable support in the hourly chart comes at 200 hourly moving average (presently at approx. 9914.1). The probable resistance in the hourly chart could be seen at 100 hourly moving average (presently at approx 10024.4) and 34 hourly moving average (presently at approx 10034.6).
The expected downward price level based on Fibonacci retracement of the up move from the previous bottom (approx. 9448.8 to 10137.9) comes at 9975.2 (23.6%), 9874.6 (38.2%), and 9793.3 (50%).
The hourly CCI and stochastic looks bearish. Moreover, the rising ADX line also suggests downside momentum in the hourly price chart. Overall Nifty remains bearish in the hourly time frame.
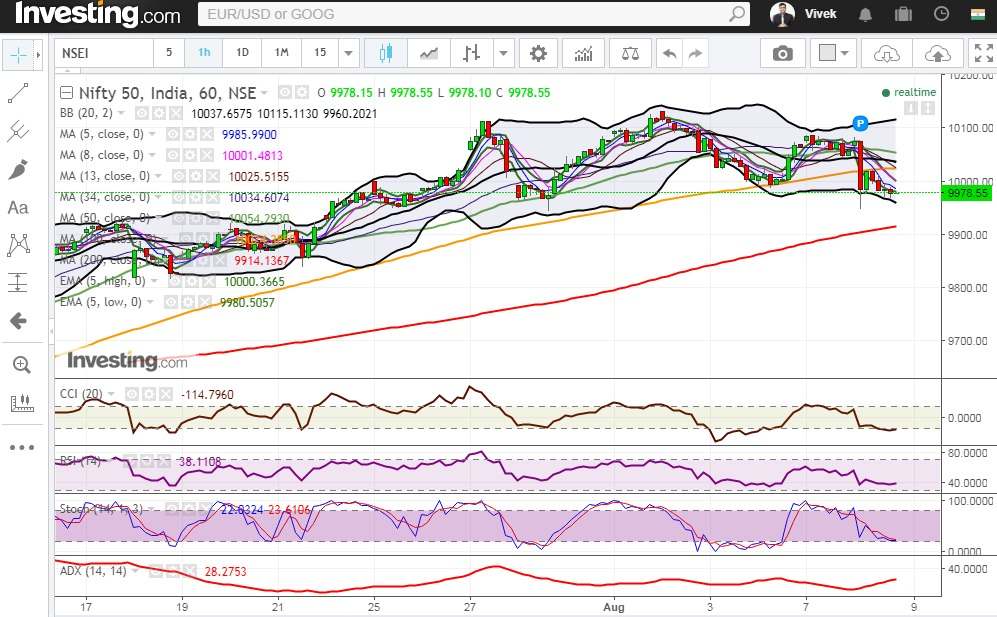
Nifty Hourly Chart
Daily Technical:
The closing of today’s candle below the 5 Low EMA (presently at approx 9994.9) indicates short term weakness. The market closed just above the mid Bollinger line or the 20 DMA (presently at 9970.06), which act as a probable support in the very short term so we should closely watch the price movement in the next 1-2 days. The next probable support in the daily chart remains at 34 DMA (presently at approx 9824.44), 50 DMA (presently at approx 9763.13) and the lower Bollinger line (presently at approx 9797.83). However, the probable resistance could be seen at 5 day low EMA (presently at approx 9994.9) and 8 DMA (presently at approx10050.7).
Daily CCI, RSI and slow stochastic have turned down from the overbought zone which is a moderate bearish signal as of now. ADX has also turned down indicating weakness in upside momentum. Overall, Nifty in the daily time frame remains neutral to bearish.
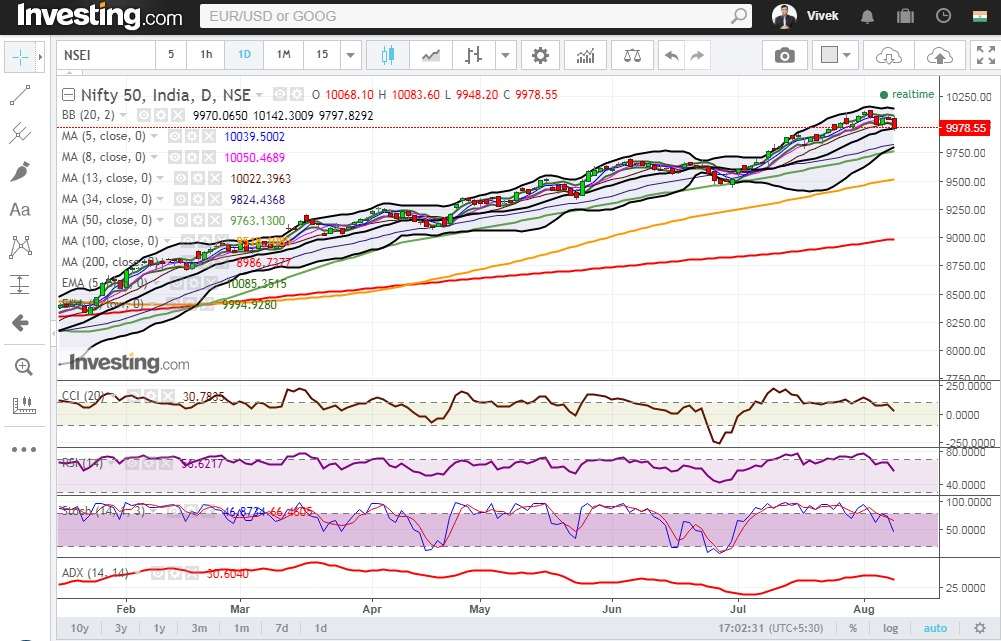
Nifty Daily Chart
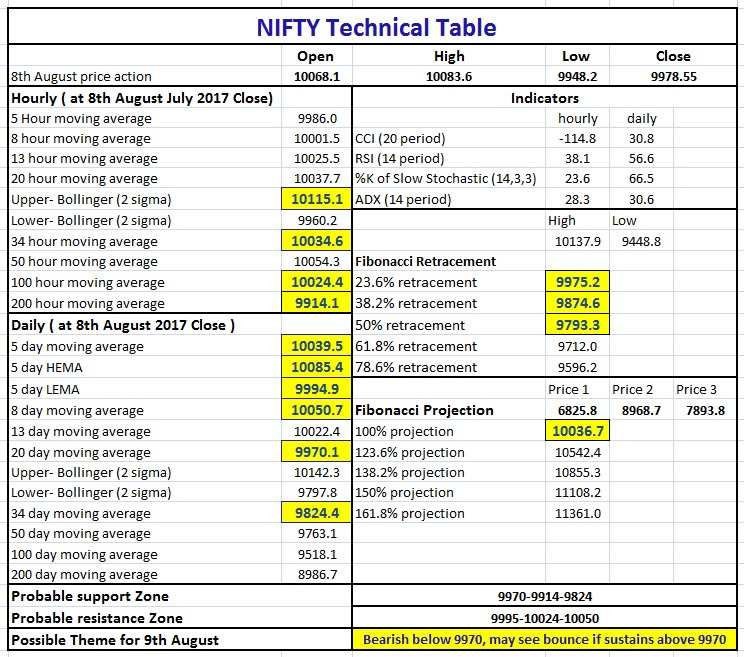
Nifty Tech Table


