Elearnmarkets - Financial Market Learning
  • Categories
    • Basic Finance
    • Derivatives
    • Financial Planning
    • Fundamental Analysis
    • Technical Analysis
    • Marketshala
    • Miscellaneous
  • Language
    • English
    • Hindi
    • Bengali
No Result
View All Result
  • Courses
  • Webinars
  • Learn On Elearnmarkets
Elearnmarkets - Learn Stock Market, trading, investing for Free
No Result
View All Result
Home Technical Analysis Market Analysis
Nifty Hourly chart

Bulls Rule July Series, August Series Begins With A Correction

Elearnmarkets by Elearnmarkets
November 18, 2020
in Market Analysis, Market Wrap
Reading Time: 4 mins read
0
98
VIEWS
Share on FacebookShare on TwitterShare on WhatsApp

Weekly Nifty and Bank Nifty Technical Analysis:

Nifty (Close 10014.5): This week, Nifty opened above the small consolidation band as shown in our last weekly report and continued uptrend. On Thursday, there was bearish engulfing pattern formed on hourly chart and market corrected on second half of Thursday and most part of Friday on back of that. Towards the end of Friday, Nifty bounced back almost 70 points from its intraday lows.

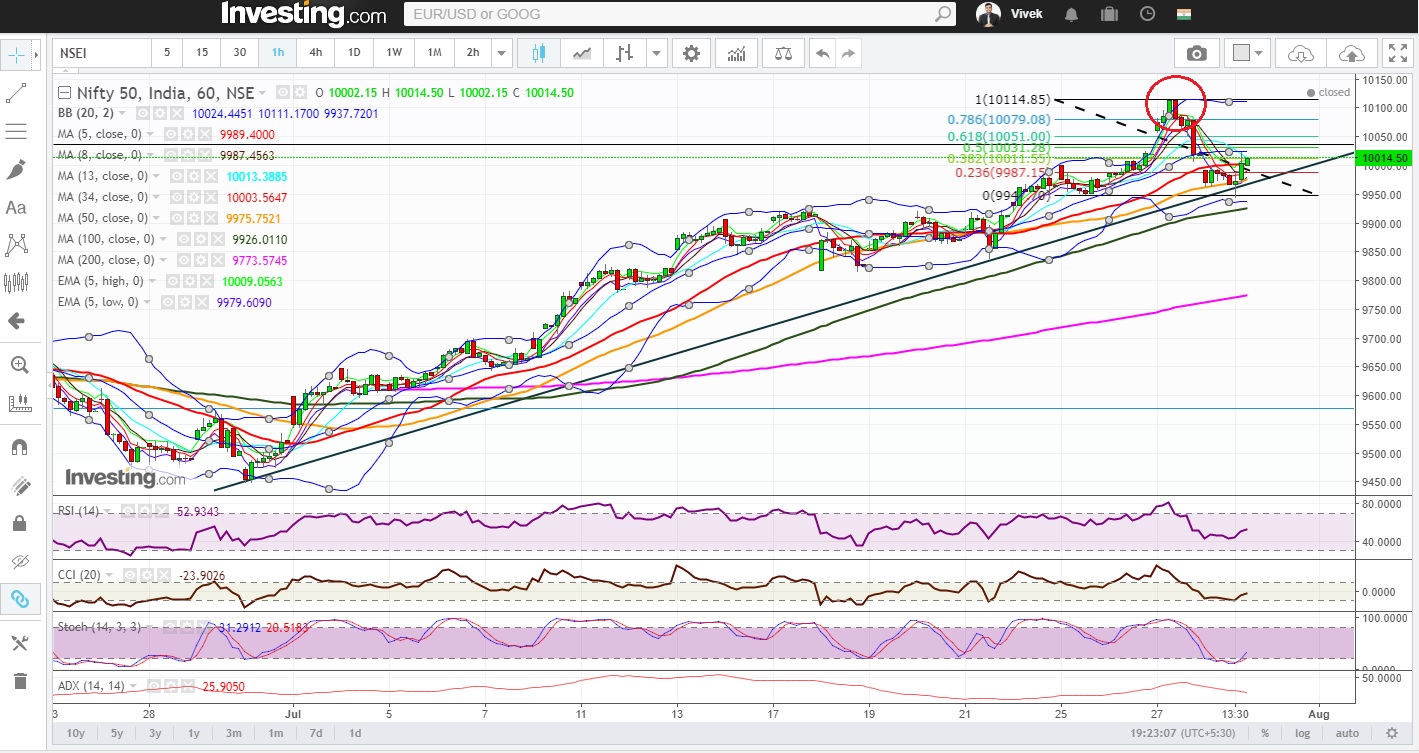
Nifty Hourly Technical: Nifty is just above the upward sloping trend line as shown in the hourly chart. There are two possibilities. Nifty may either obey this trend line and resume its uptrend from here, or it can break the trend line and eventually break the 100 hour moving average to extend its correction.

On the downside, 50 hour moving average, 100 hour moving average and 200 hour moving average should be logical support levels to look at, which presently stand at approx. 9976, 9926 and 9774 respectively.

On the upside, hourly mid Bollinger (presently at approx. 10025), approx. 10050 (61.8% retracement level of the present fall) and approx.10081 (approx. 80% retracement of the recent fall) should act as possible hurdles.

Hourly CCI, RSI are in neutral zone, while hourly slow stochastic is just entering in neutral zone from over sold zone. Hourly ADX is losing momentum. Overall, neutral to slightly bearish on momentum parameters. But, multiple hourly closes above the hourly mid-Bollinger line will likely negate bearishness.

Nifty Hourly chart

Join TMP Join TMP Join TMP

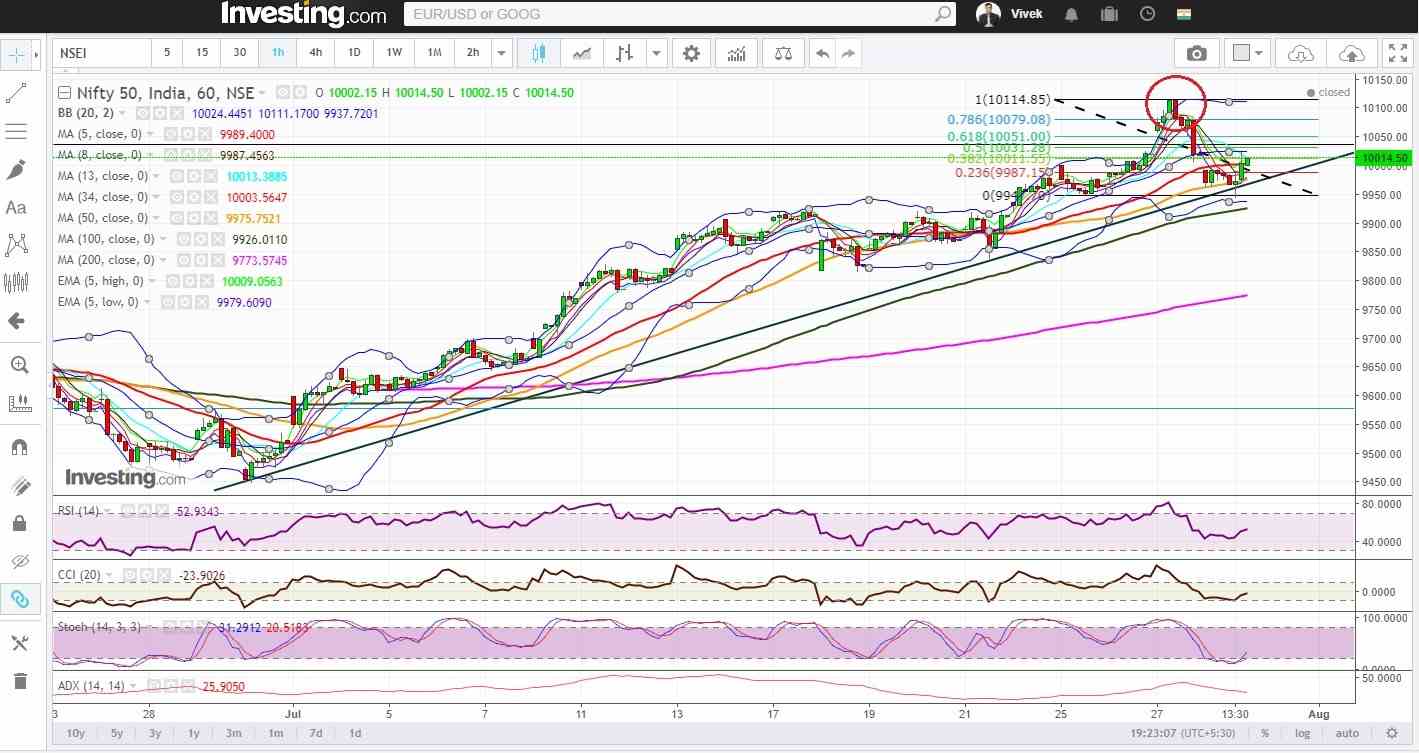
Figure: Nifty Hourly chart

Nifty Daily Technical: The Nifty is Neutral to bullish in daily time frame. On the downside, supports may emerge near 13 DMA (presently at approx. 9924), 20 DMA (presently at approx.9839). There can be correction even to 34 DMA or 50 DMA, but the overall bullishness that started from December 2016, will not be altered until and unless Nifty breaks 100 DMA (presently at 9443 approx.).

On the upside, upper Bollinger band (presently at 10106 approx.) should act as resistance.

Daily RSI and daily slow stochastic are in overbought zone, while daily CCI has just entered into the normal zone. ADX is neutral to bullish.

Nifty Hourly chart
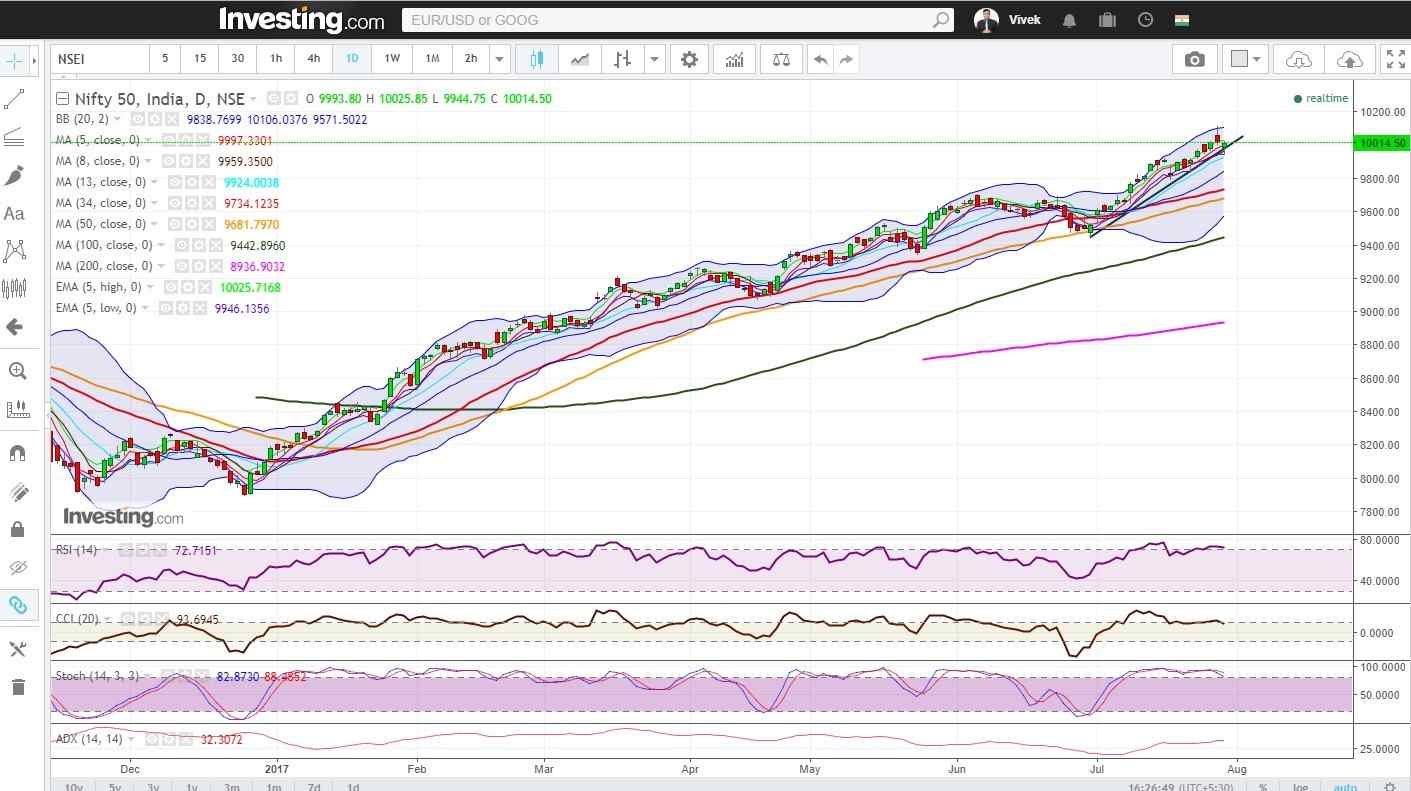
Figure: Nifty Daily chart

Nifty Weekly Technical: In weekly chart, Nifty remains firmly bullish. Weekly CCI, RSI, slow stochastic, ADX are bullish. Weekly close above 10036 (approx. 100% projection of the move from approx.6826 to approx. 8969, from Dec 2016 low of approx. 7893) will open up Nifty for higher projection targets (10542, 10855, 11108, 11361 etc.) as shown in the following weekly chart.

Nifty Weekly chart

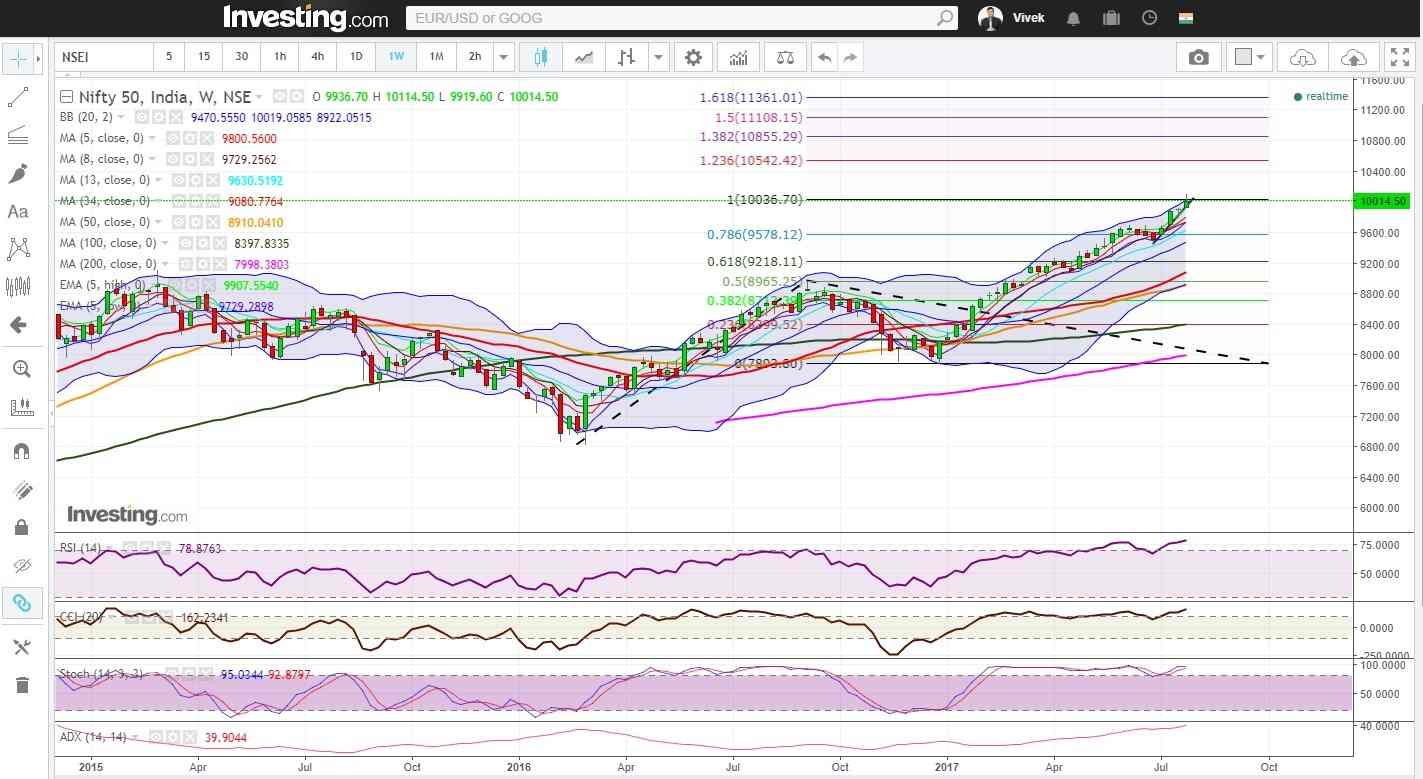
Figure: Nifty Weekly Chart

Nifty Tech table

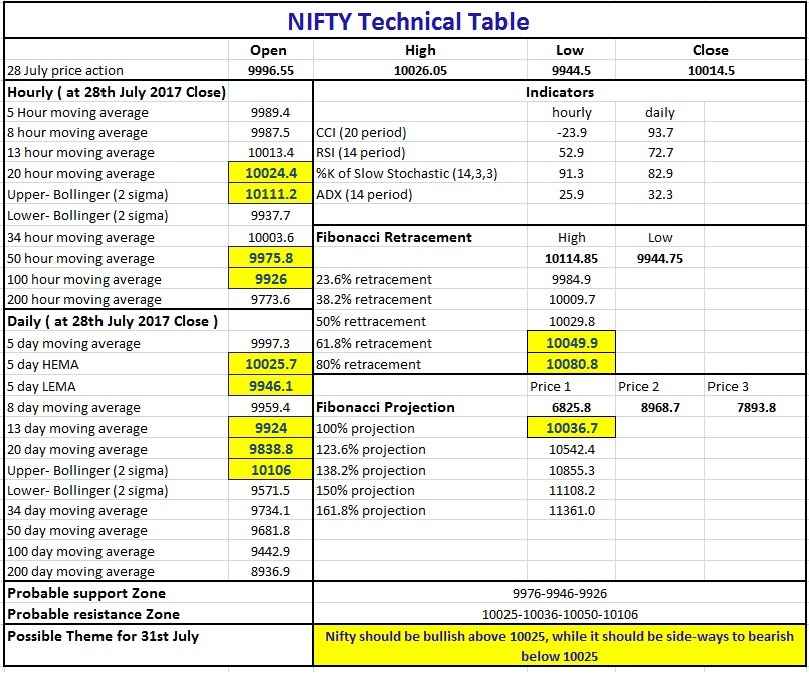
Figure: Nifty Tech table

Bank Nifty (weekly close approx. 24811.30):

Bank Nifty: This week Bank Nifty continued the steady uptrend. On Thursday just before expiry there was a bearish engulfing pattern formed in hourly chart, which resulted in a corrective down move. Towards the end of the week, Bank Nifty took support near 34 hour moving average and had a minor 160-170 point bounce.

Bank Nifty Hourly Technical: The very recent up move which started from end of June has been all through very steady and supported by 34 hour moving average on the downside. This time also, Bank Nifty has bounced back from 34 hour moving average (presently at approx. 24687.7) on Friday.

On the downside, 34 hour moving average, and 50 hour moving average may act as probable immediate supports.

On the upside, 13 hour moving average (presently at approx. 24845) is the borderline between the bulls and the bears for now. Once, above that, Bank Nifty can resume its uptrend and aim for new highs.

Hourly CCI, RSI are in neutral zone, while hourly slow stochastic is just showing possibility of bottoming out. Hourly ADX is trending down.

Bank Nifty Hourly chart

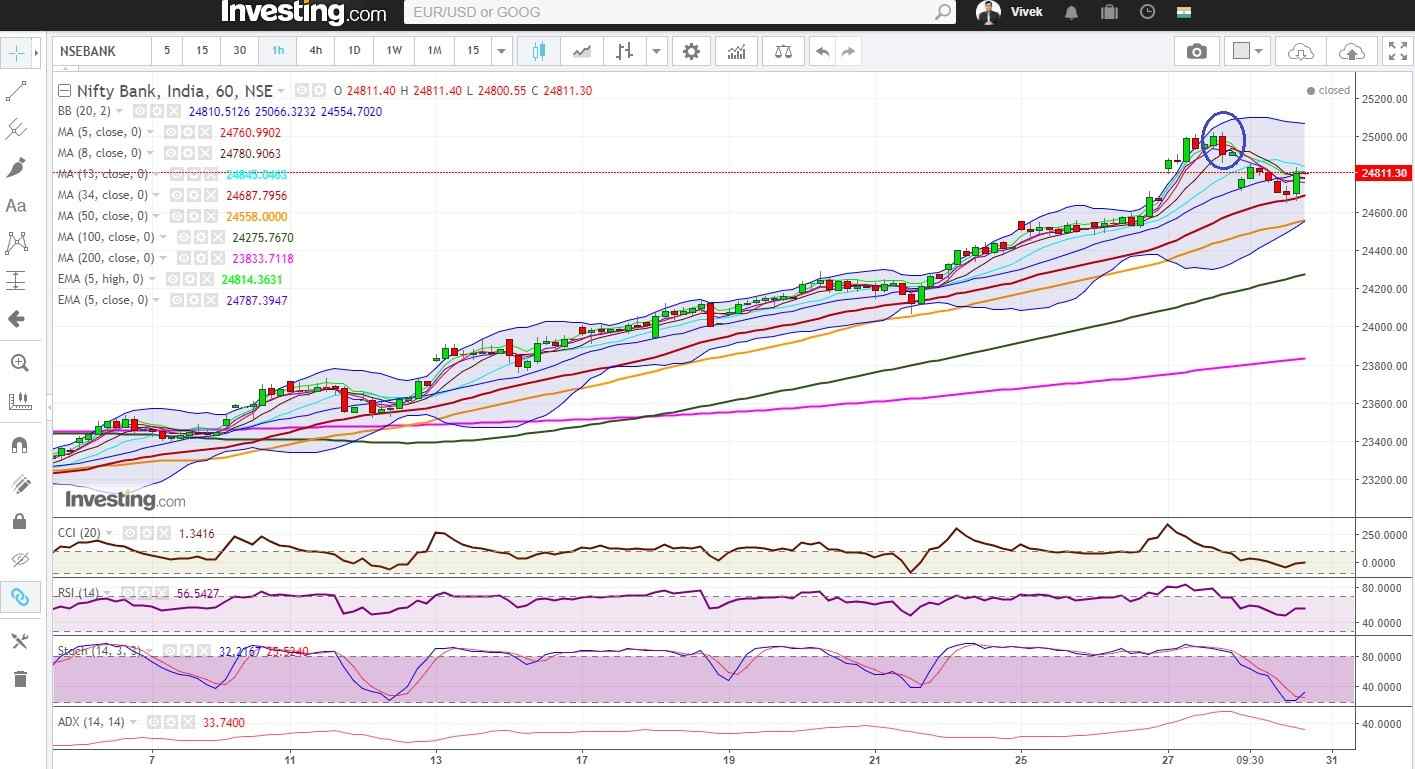
Figure: Bank Nifty Hourly chart

Bank Nifty Daily Technical: In daily chart, Bank Nifty is bullish to neutral. Daily CCI, RSI, slow stochastic are in overbought zone and daily ADX is trending up.

On the down side, support may emerge at 5 DMA (approx. 24669 presently), 8 DMA (approx. 24496 presently) and 13 DMA (approx. 24271 presently).

On the upside, the bank Nifty can move to daily upper Bollinger line (presently at approx. 24984) or higher.

Bank Nifty Daily chart
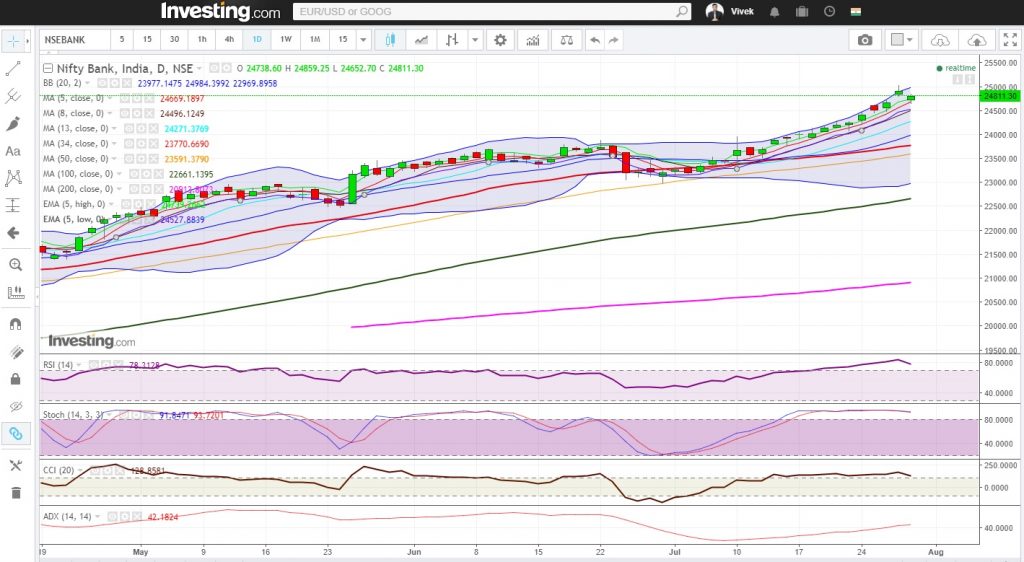
Figure: Bank Nifty Daily chart

Bank Nifty Weekly Technical: Weekly CCI, RSI, slow stochastic, ADX are in respective overbought zones and indicating firmly bullish momentum of Bank Nifty in the weekly time frame.

On the downside, major weekly support remains near 8 week moving average (presently at approx. 23800).

The most significant point is that, Bank Nifty gave weekly close above 24775 (approx. 100% projection of the move from approx.13407 to approx. 20576 from December 2016 low of approx. 17607). This opens up bank Nifty for higher Fibonacci projection targets (26467, 27514, 28360, 29206 etc. as shown in the weekly chart and tech. table below).

Weekly Bank Nifty chart

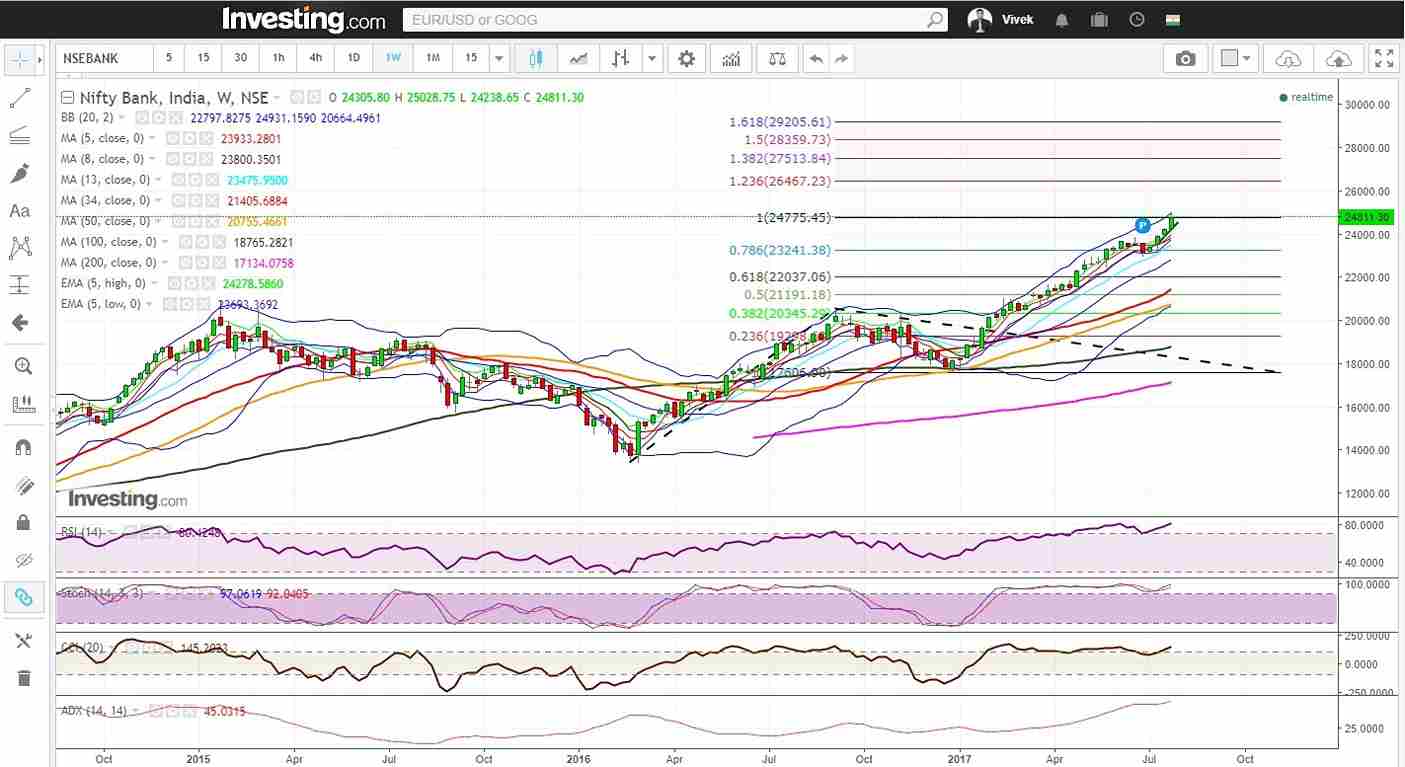
Figure: Weekly Bank Nifty chart

Bank Nifty Technical Table
Figure: Bank Nifty Tech table

Tags: english
ShareTweetSend
Previous Post

Triple screen trading system: the Alexander Elder way of trading

Next Post

Nifty Zooms In The Last 30 Minutes And Hits A Fresh Life Time High

Elearnmarkets

Elearnmarkets

Elearnmarkets (ELM) is a complete financial market portal where the market experts have taken the onus to spread financial education. ELM constantly experiments with new education methodologies and technologies to make financial education effective, affordable and accessible to all. You can connect with us on Twitter @elearnmarkets.

Related Posts

Hourly Chart
Market Analysis

Nifty Ends on Positive Note, Gains Approx. 475 Points on Positive Global Factors

November 18, 2020
378
Weekly Chart
Market Analysis

Huge Sell-Off Makes the Market Close in a Negative Note on the Expiry Week

November 18, 2020
175
Hourly Chart
Market Analysis

Nifty Ends in Green. Rupee Appreciates and Falling Crude Price Helped the Market to Recover Approx. 140 Point

November 18, 2020
129
Hourly Chart
Market Analysis

Sell Off Continues. Nifty Ends The Week With Three Consecutive Red Candles

November 18, 2020
141

Leave a Reply Cancel reply

Your email address will not be published. Required fields are marked *

Follow Us

Facebook-f Twitter Instagram Linkedin-in Youtube Telegram

Register on Elearnmarkets

Continue your financial learning by creating your own account on Elearnmarkets.com

Register Free Account

Download App

Categories

  • Basic Finance
  • Derivatives
  • Financial Planning
  • Fundamental Analysis
  • Technical Analysis
  • Marketshala
  • Miscellaneous

Popular On Elearnmarkets

  • Market Superheroes:
  • Vivek Bajaj
  • Chetan Panchamia
  • Ashish Kyal
  • Premal Parekh
  • Abhijit Paul
  • Jegan
  • Sivakumar Jayachadran
  • Vishal Malkan
  • Jyoti Budhia
  • Vivek Gadodia
  • Vishal Mehta
  • Piyush Chaudhry
  • Santosh Pasi
  • Gomathi Shankar
  • Market Superheroes:
  • Vivek Bajaj
  • Chetan Panchamia
  • Ashish Kyal
  • Premal Parekh
  • Abhijit Paul
  • Jegan
  • Sivakumar Jayachadran
  • Vishal Malkan
  • Jyoti Budhia
  • Vivek Gadodia
  • Vishal Mehta
  • Piyush Chaudhry
  • Santosh Pasi
  • Gomathi Shankar
  • Courses:​
  • Options Trading
  • Dow Theory
  • Momentum Trading
  • Stock Investing
  • Stock Market for Beginners
  • Harmonic Chart Patterns
  • Algo Trading
  • Elliot Wave Theory
  • Advanced Excel
  • Cryptocurrency
  • NSE Certification Course
  • Courses:​
  • Options Trading
  • Dow Theory
  • Momentum Trading
  • Stock Investing
  • Stock Market for Beginners
  • Harmonic Chart Patterns
  • Algo Trading
  • Elliot Wave Theory
  • Advanced Excel
  • Cryptocurrency
  • NSE Certification Course
  • Webinars:
  • Bank Nifty Scalping
  • Intraday Trading Strategies
  • Options Trading Strategies
  • Options selling
  • Price Action
  • Relative Strength
  • Tax Planning
  • Options Buying
  • Growth Stocks
  • Portfolio Management
  • Relative Strength Index
  • Risk Management
  • Renko Charts
  • Crude Oil
  • Traders Psychology
  • Moving Average
  • Multibagger Stocks
  • Free Learning Modules:
  • Intraday Trading
  • Options Scalping
  • Swing Trading
  • Financial Modelling
  • RSI Indicator
  • Bollinger Bands
  • Pricing of Futures
  • Personal Finance
  • Initial Public Offerings (IPO)
  • Value Investing
  • Technical Indicators
  • Candlesticks
  • Chart Patterns
  • Option Greeks
  • ELSS Funds
  • Banking and Insurance
  • Real Estate
  • Gold
  • Book Summaries:
  • Rich Dad Poor Dad
  • Psychology of Money
  • The Intelligent Investor
  • The Richest Man in Babylon
  • Think and Trade Like a Champion
  • Value Investing and Behavioural Finance
  • Trading in the Zone
  • Learn to Earn
  • Book Summaries:
  • Rich Dad Poor Dad
  • Psychology of Money
  • The Intelligent Investor
  • The Richest Man in Babylon
  • Think and Trade Like a Champion
  • Value Investing and Behavioural Finance
  • Trading in the Zone
  • Learn to Earn
  • Tools:
  • CAGR Calculator
  • SIP Calculator
  • eLearnOptions
  • Future Value Calculator
  • Present Value Calculator
  • Atal Pension Yojana
  • Cost of Delay Calculator
  • Become a Crorepati
  • Tools:
  • CAGR Calculator
  • SIP Calculator
  • eLearnOptions
  • Future Value Calculator
  • Present Value Calculator
  • Atal Pension Yojana
  • Cost of Delay Calculator
  • Become a Crorepati

© 2023 Elearnmarkets. All Rights Reserved

  • Visit Elearnmarkets
  • Courses
  • Webinars
  • Financial Guides
  • Get Free Counselling
  • Visit Elearnmarkets
  • Courses
  • Webinars
  • Financial Guides
  • Get Free Counselling

Get Elearnmarkets App

No Result
View All Result
  • Article Categories
    • Basic Finance
    • Derivatives
    • Financial Planning
    • Fundamental Analysis
    • Technical Analysis
    • Marketshala
    • Miscellaneous
  • Language
    • Hindi
    • Bengali
    • English
  • Courses
  • Webinars

© 2020 Elearnmarkets All Rights Reserved

Suggested Learning

Technical Analysis Made Easy

Certification in Online Technical Analysis

Online NSE Academy Certified Capital Market Professional (E-NCCMP)