Key Takeaways
- Inside Bar is a two-candle pattern where the second candle is within the range of the first, showing market consolidation.
- Works best on higher timeframes and in trending markets for reliable signals.
- Most effective after breakouts, suggesting a continuation or trend reversal.
- Smaller inside bars within large mother bars offer better trading setups.
- Entry is on breakout of the range; stop-loss is set below or above the mother bar.
An inside bar pattern doesn’t come around often. If you ask, why is it? So the answer is, it’s mostly due to the fact that this particular strategy requires a trend that is strong but not exhausted.
As markets spend most of their time consolidating or ranging, finding a favorable inside bar setup within a trending market can be a difficult task. Now, you might be having a question about what is inside the bar chart pattern?
- Key Takeaways
- What is Inside Bar Pattern?
- Facts about Inside Bar Pattern
- 6 important characteristics to know about the Inside bar setup pattern:
- 1. Choosing the correct time frame
- 2. Works extremely well in trending market
- 3. Inside Bar Setup on a Pattern breakout
- 4. Size of the Mother candle and inside bar candle
- Learn How to make a profit out of failed breakouts in just 2 hours by Market Experts
- 5. Entering, Exiting and Stop loss at Inside Bar Trade
- 6. Inside bar Pattern helps in identifying change in trend
- 6 important characteristics to know about the Inside bar setup pattern:
- Bottomline:
- Frequently Asked Questions
What is Inside Bar Pattern?
As the name suggests, an inside bar chart pattern engulfs the inside of a large candle, some call it a mother bar. It’s a pattern that forms after a large move in the market and represents a period of consolidation.
The inside bar pattern can be a very powerful price action signal if you understand how to trade it properly. Matching lows and highs are acceptable, however, the inside bar’s range must not be outside of the mother candle by even 1 point.
Here are some facts about Inside Bar Pattern-
Facts about Inside Bar Pattern
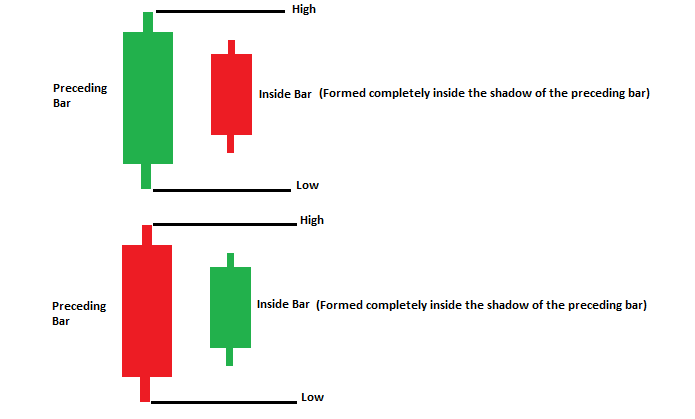
- Inside bar pattern within the trading range (or shadow) of the preceding bar.
- It is at least a two-candlestick formation
- Mother candlestick can be either bullish(green) or bearish(red)
- The inside bar chart pattern can be bullish or bearish
6 important characteristics to know about the Inside bar setup pattern:
1. Choosing the correct time frame
The first and the most important characteristic is, the time frame you use to set up the inside bar is extremely important. As in general, any time frame less than the daily chart should be avoided with this strategy.
This is because the lower time frames are influenced by “noise” and therefore might produce false signals.
An inside bar that forms on the higher time frame has more “relevant” simply because the pattern took more time to form. This means more traders were actively involved in its formation.
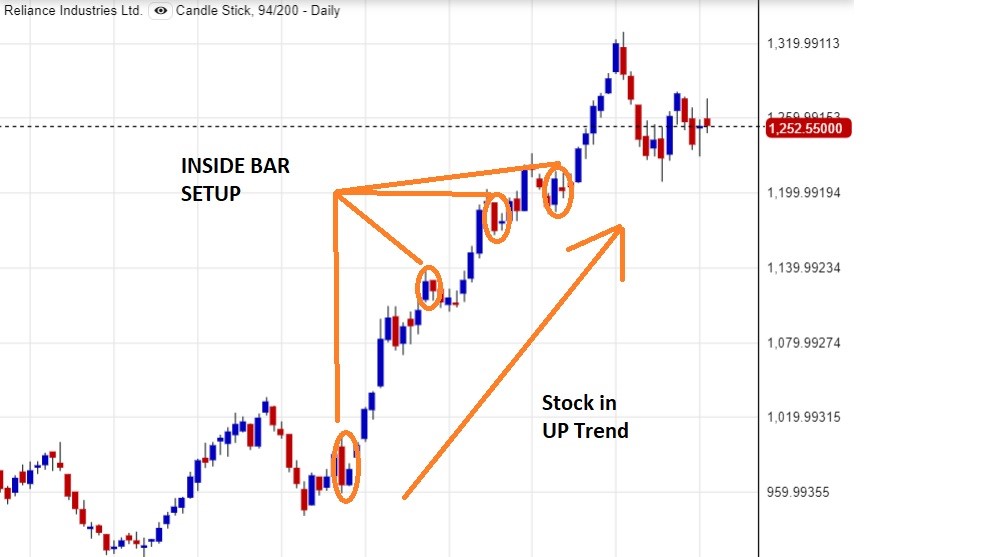
2. Works extremely well in trending market
If you are planning to trade based on an inside bar candlestick pattern, then you should always look for a market trend. This strategy does not work in a choppy market or sideways market as you will be easily stopped out.
In fact, trading with the trend is the only way to trade an inside bar setup. Note that this pair was in a strong uptrend leading up to both setups. This is the kind of momentum you want to look for when trading this strategy.
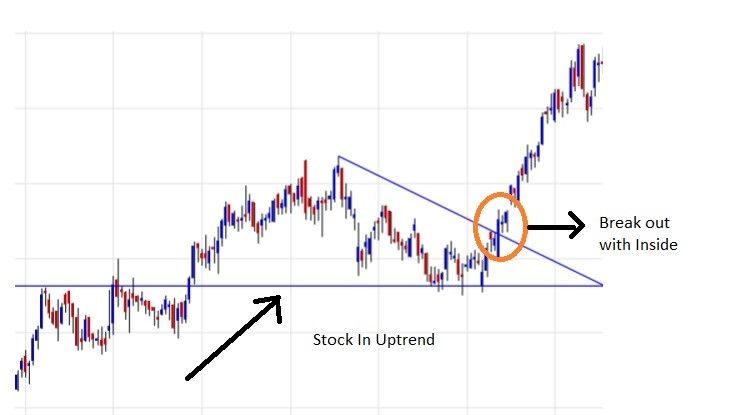
3. Inside Bar Setup on a Pattern breakout
The best inside bar setups form just after a breakout from a preceding pattern. The reason for this is simple. In a trend, the consolidation is triggered when longs decide to begin taking profits (selling).
This causes the market to pull back, where new buyers have to take charge in and buy, which keeps prices elevated. Inside bar pattern continues for days, weeks or even months until new buyers are able to once again outweigh the sellers and drive the market higher.
Below is a great example of a bullish inside bar pattern that formed on the Hindustan Unilever daily time frame. This is actually a trade setup that was called here at Daily Price Action and has worked out beautifully thus far.
4. Size of the Mother candle and inside bar candle
The size of the inside bar compare to the mother bar is very important. In my experience, the smaller the inside bar is relative to the mother bar, the greater your chances of experiencing a profitable trade setup.
Ideally, we want to see the inside bar form within the upper or lower half of the mother bar.
Learn How to make a profit out of failed breakouts in just 2 hours by Market Experts
If the mother bar has a weak body then it might not be very sure to trade in it. The body and the size of the mother bar are extremely important, and if the size of the inside bar is small compared to the mother bar it can help you to generate much better results.
5. Entering, Exiting and Stop loss at Inside Bar Trade
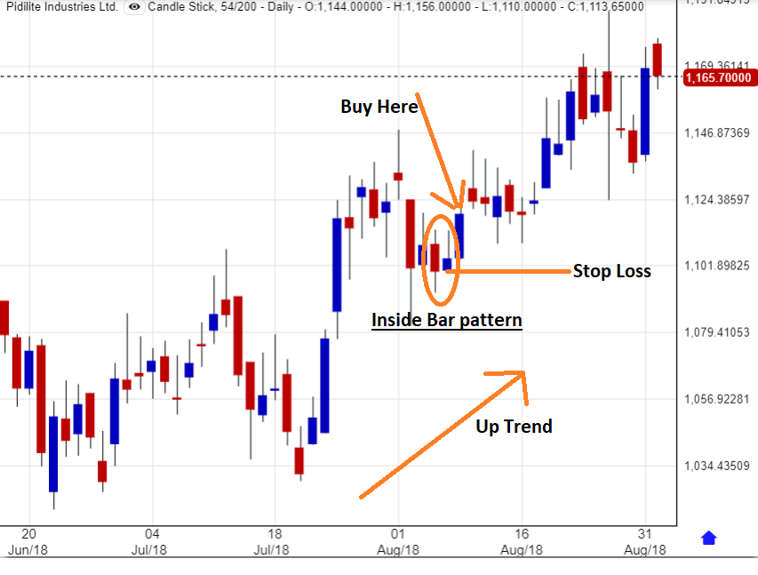
Entering – When the price action completes an inside candlestick chart pattern, you should mark the low and high of the Inside Bar consolidation range. These two levels are used to trigger a potential trade.
Remember, the inside candle clues us into the eventual breakout and likelihood of a continuation outside the range in the direction of the break, however, it doesn’t give us information about the direction of the breakout through the range, prior to the actual move.
In simple terms, if the price action interrupts the range upwards, then you should go long. If the price action breaks the range downwards, then you should trade the short side.
Exiting – Projecting the potential move with Inside Bar Breakouts can be challenging. Often inside bar trades can lead to a prolonged impulse move after the breakout, so employing a trailing stop loss after the price has moved in your favor is a smart trade management strategy.
Stop Loss – In either case (If you are Long or short), your stop should be located below the bottom of the range, as stated in the picture below. There can be a buffer of 1% below the range.
6. Inside bar Pattern helps in identifying change in trend
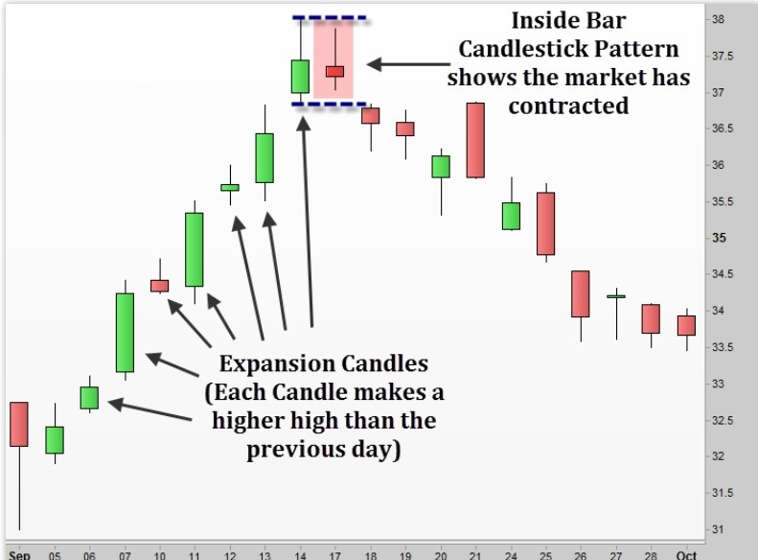
The inside bar candlestick pattern is such a valuable tool because it tells us that the market is not as bullish or bearish as it was in the preceding period.
Being able to identify periods of market expansion and contraction will help any trader improve their odds of finding a winning trade because we know from history that expansion and contraction can only last so long.
When either of those market phases ends, the resulting moves can be explosive!

Also Read: How to trade with Spinning Top: Candlestick Pattern
The great thing about inside bar candlestick patterns is that they provide visual evidence that the market has contracted and may be ready to reverse the current trend.
Bottomline:
There’s no doubt that inside bars can be a profitable way to trade the Forex market, equity, commodity or any other market. After all, it’s a setup that it teaches as part of the price action course and one that has served extremely well.
However, it isn’t a setup that occurs often, at least not in a favorable context. This is why I don’t advocate using the inside bar candlestick pattern as your only set-up to trade the market.
By doing so, you limit your trade potential to the point that you are likely to begin taking subpar setups. It is, therefore, important to treat inside bars as another tool inside your trading toolbox rather than the toolbox itself.
The inside bar setup is capable of producing consistent profits, but only for the traders who mind the six characteristics discussed above.
Also, read about the Outside Bar pattern: 7 Bar Patterns Traders should know.
Frequently Asked Questions
Is an inside day bullish or bearish?
Inside day is both bullish and bearish candlestick pattern.
What does an inside day pattern indicate?
The candlestick pattern indicates a continuation of the prior trend.
How to identify an Inside bar candle?
One can identify this pattern by:
Inside bar pattern within the trading range (or shadow) of the preceding bar. It is at least a two candlestick formation Mother candlestick can be either bullish(green) or bearish(red). The inside bar chart pattern can be bullish or bearish.


Nice
Hi,
We really appreciated that you liked our blog! Thank you for your feedback!
Keep Reading
Better 👌
Hi,
We really appreciated that you liked our blog! However, there is no option to download the same.
Thank you for Reading!
Keep Reading!
Woderfull. Simple to grasp. Thanks