Nifty (Close approx. 9897.3): Market opened gap up and closed in green in today’s session.
As mentioned in the last day’s report that a strong pullback is expected above 9842 and at the same time market took a strong support at 20 hour Moving average (presently at approx. 9774 ) from where the market steadily moved higher.
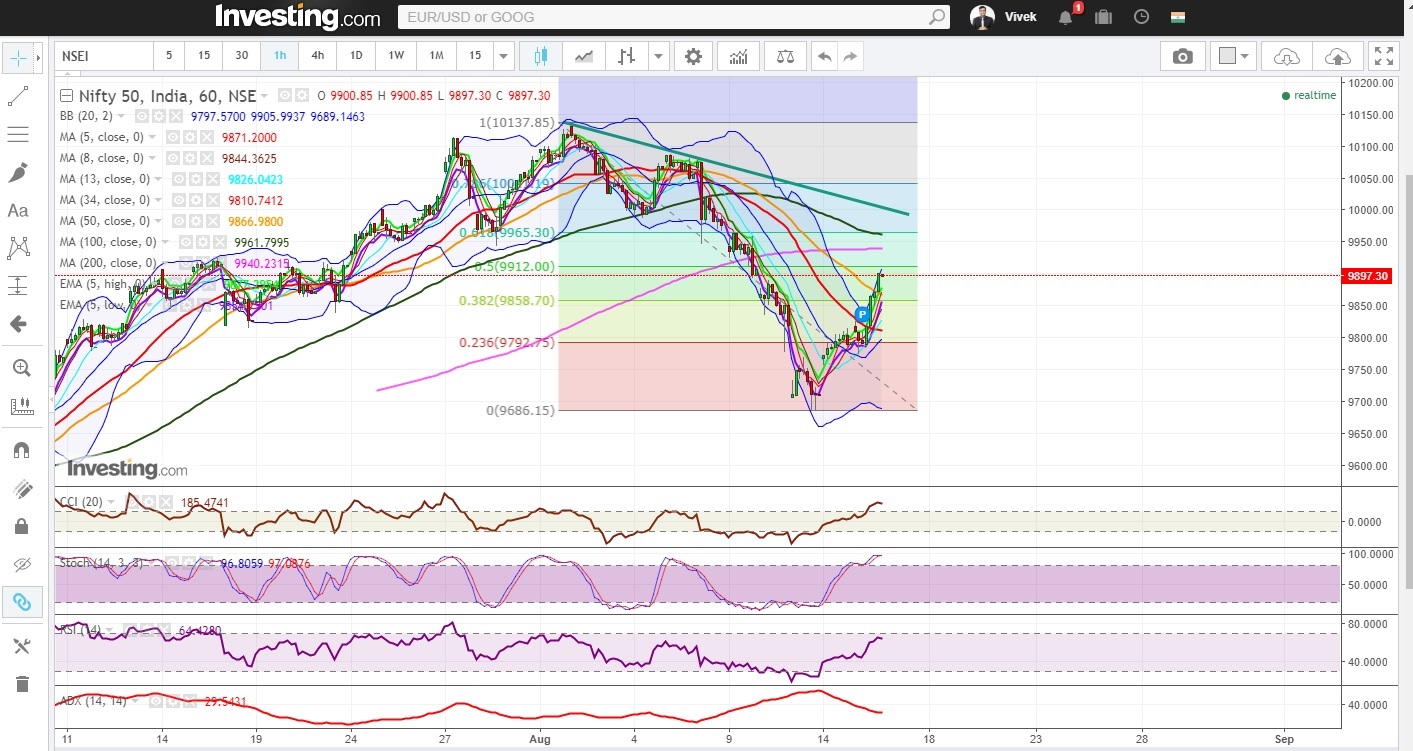
Hourly Technical:
Nifty closed above 50 Hourly moving average (presently at approx. 9867) is positive in the short term. On the upside, 200 Hourly moving average (presently at approx. 9940.2) may act as a strong resistance in the near term. However, looking at the momentum in the Hourly chart, it appears Nifty may go to psychological 10000 mark, if upside momentum continues.
The probable support in the hourly chart comes at 5 Hour Low EMA (presently at approx. 9854.8), 13 Hourly moving average (presently at approx. 9826) and 20 Hourly moving average (presently at approx.9798 ). The probable resistance in the hourly chart could be seen at 200 Hourly moving average (presently at approx.9940.2) and 100 Hourly moving average (presently at approx. 9961.8).
The hourly CCI and RSI are in the overbought zone and hourly RSI is close to upper bound 70 level. Moreover, the hourly ADX is trending down. Overall these indicators indicate bullish view in the hourly time frame.
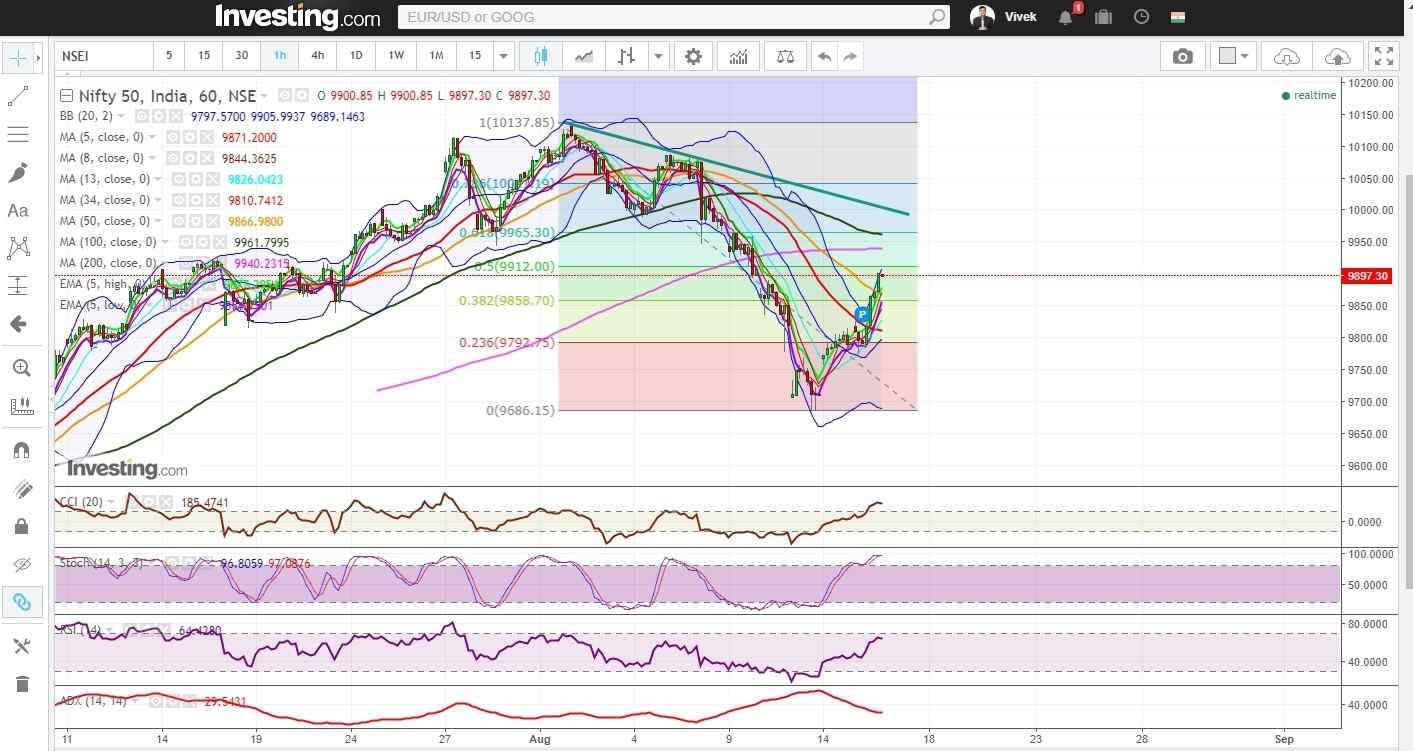
Nifty Hourly Chart
Daily Technical
Nifty was up by 103.15 points in today’s trade. In the daily chart, Nifty closed above 5 Day High EMA (presently at approx. 9892) which is slightly positive in the near term.
The next probable support in the daily chart remains at 5 Day Low EMA (presently at approx. 9793.3). On the upside, the probable resistance could be 13 Day moving average (presently at approx. 9964.2) and 78.6% retracement level of the down move from approx. 10088 to aprrox.9686 (presently at approx. 10001.8).
The Daily CCI, RSI and Stochastic have turned up from the oversold zone which suggests positive bias and Daily ADX is neutral. Overall Nifty in the daily time frame remains neutral.
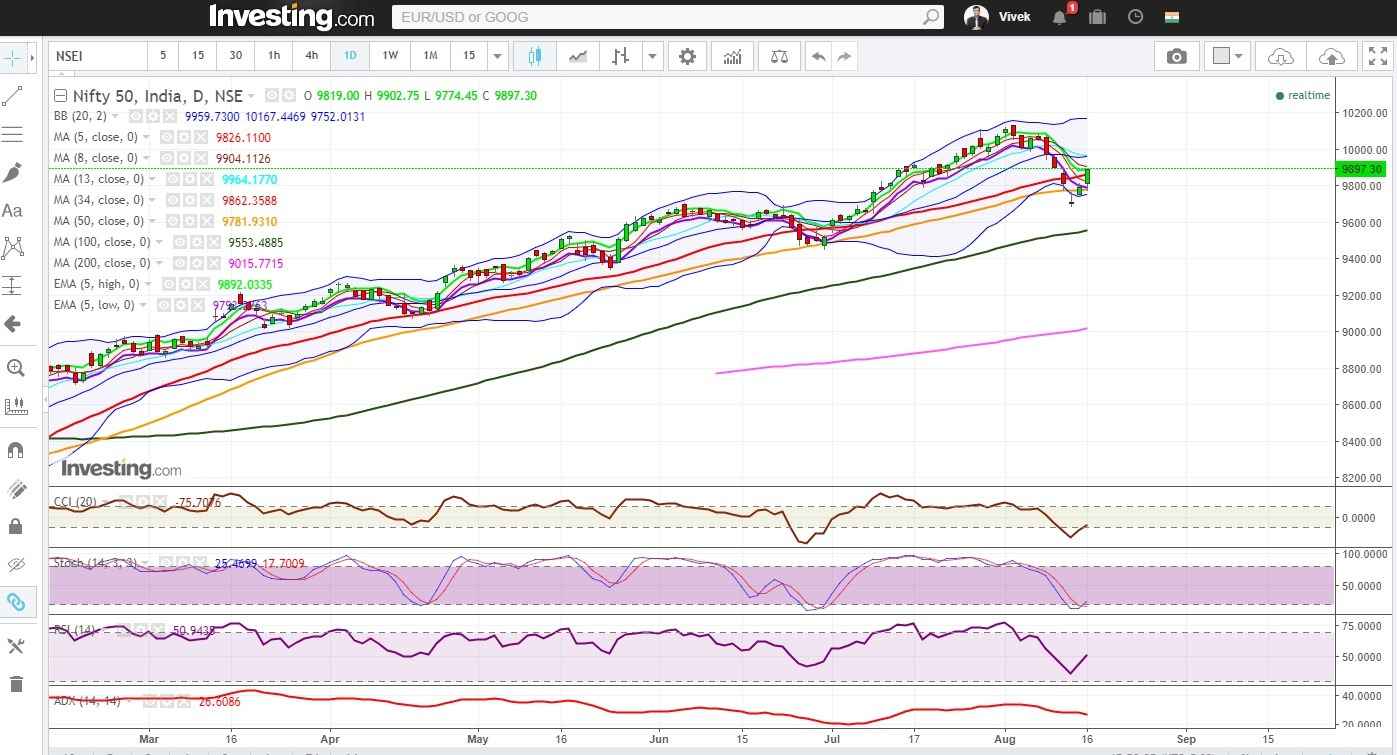
Nifty Daily Chart
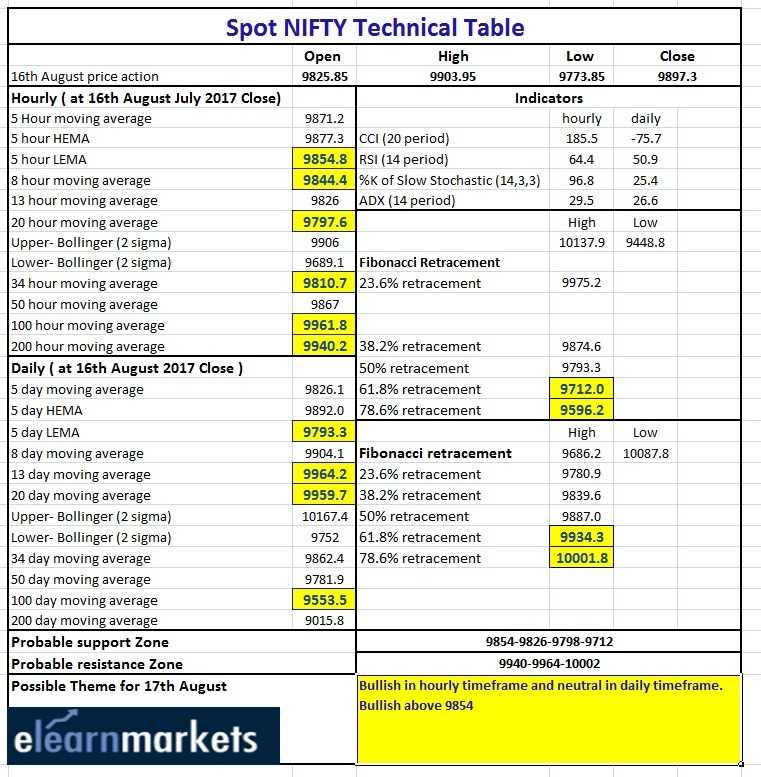
Nifty Tech Table


