Nifty (Close approx. 9794.15): Market opens gap up and closed in green in today’s session with today’s price action confirming inverted hammer candlestick pattern in the daily chart.
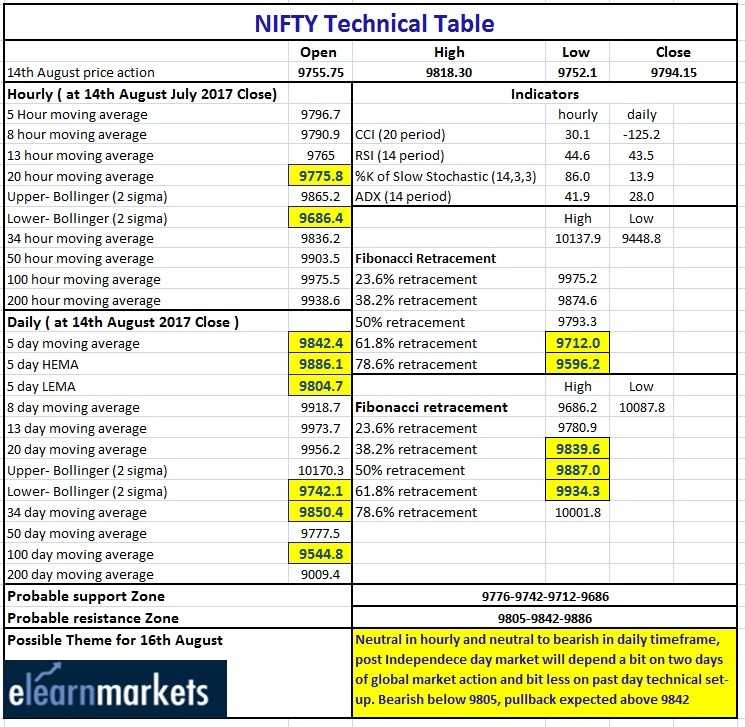
As mentioned in the last day’s report that a strong pullback is possible if Nifty sustains above 9774 and at the same time there was a strong resistance in the hourly chart (9818-mentioned in tech table) from where the market saw profit booking today in the last one hour.
Hourly Technical:
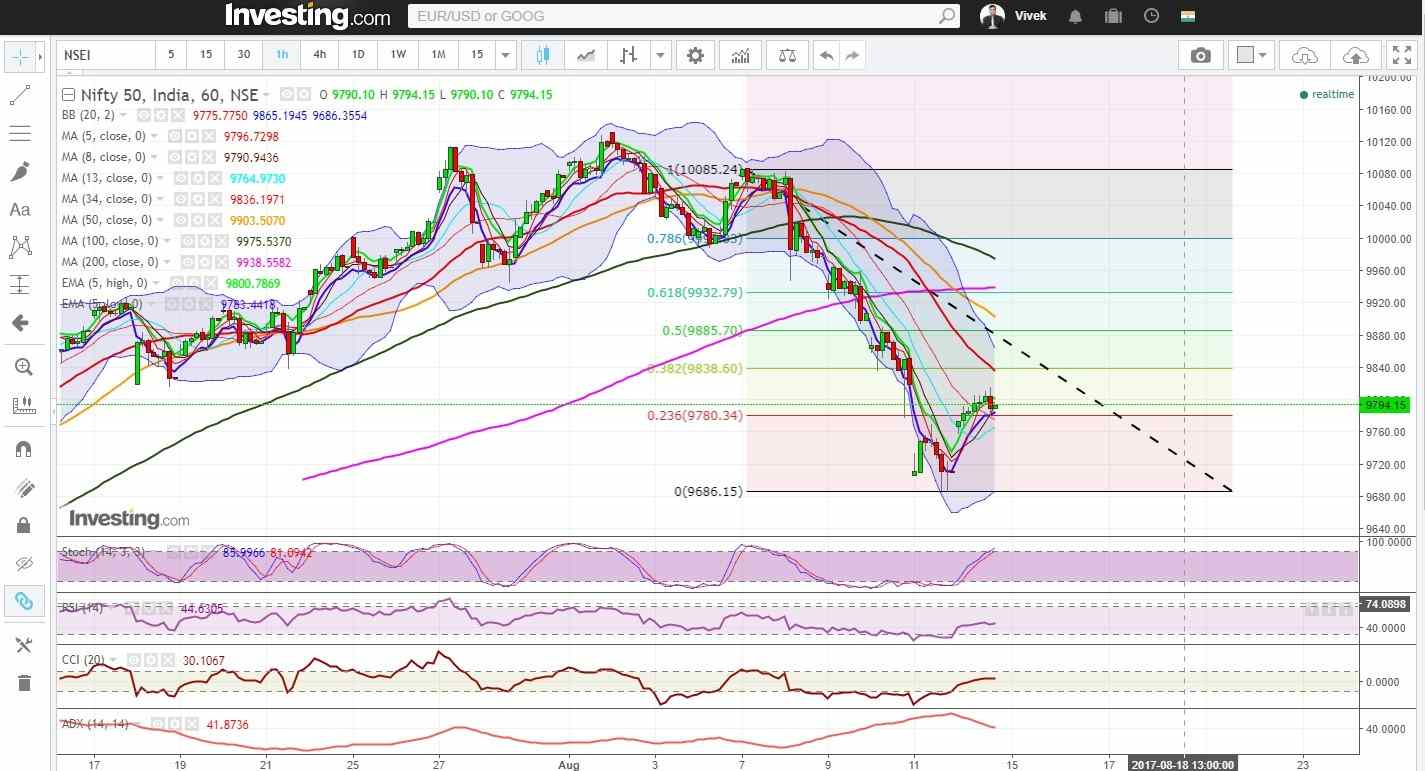
Nifty opened gap up by more than 50 points and was up for most part of the day. The close above the mid Bollinger line (presently at approx 9775.8) is positive in the short term, however the 34 DMA line (presently at approx. 9836.2) may act as a strong resistance in the near term. Unless Nifty closes and sustains above the 34 hourly moving average, market remains neutral to bearish in the hourly chart.
The probable support in the hourly chart comes at 20 hours moving average (presently at approx. 9775.8), 61.8% retracement (presently at approx. 9712) and lower Bollinger line (presently at approx. 9686.4). The probable resistance in the hourly chart could be seen at 34 hour moving average (presently at approx. 9836.2) and 50 hour moving average (presently at approx. 9903.5).
The expected downward price level based on Fibonacci retracement of the up move from the previous bottom (approx.9448.8. to 10137.9) comes at 9712 (61.8%) and 9596.2 (78.6%).
The hourly CCI, RSI are in neutral zone and hourly stochastic has just entered in the overbought zone. Moreover, the hourly ADX is trending down. Overall these indicators indicate neutral view in hourly time frame.

Figure: Nifty Hourly Chart
Daily Technical
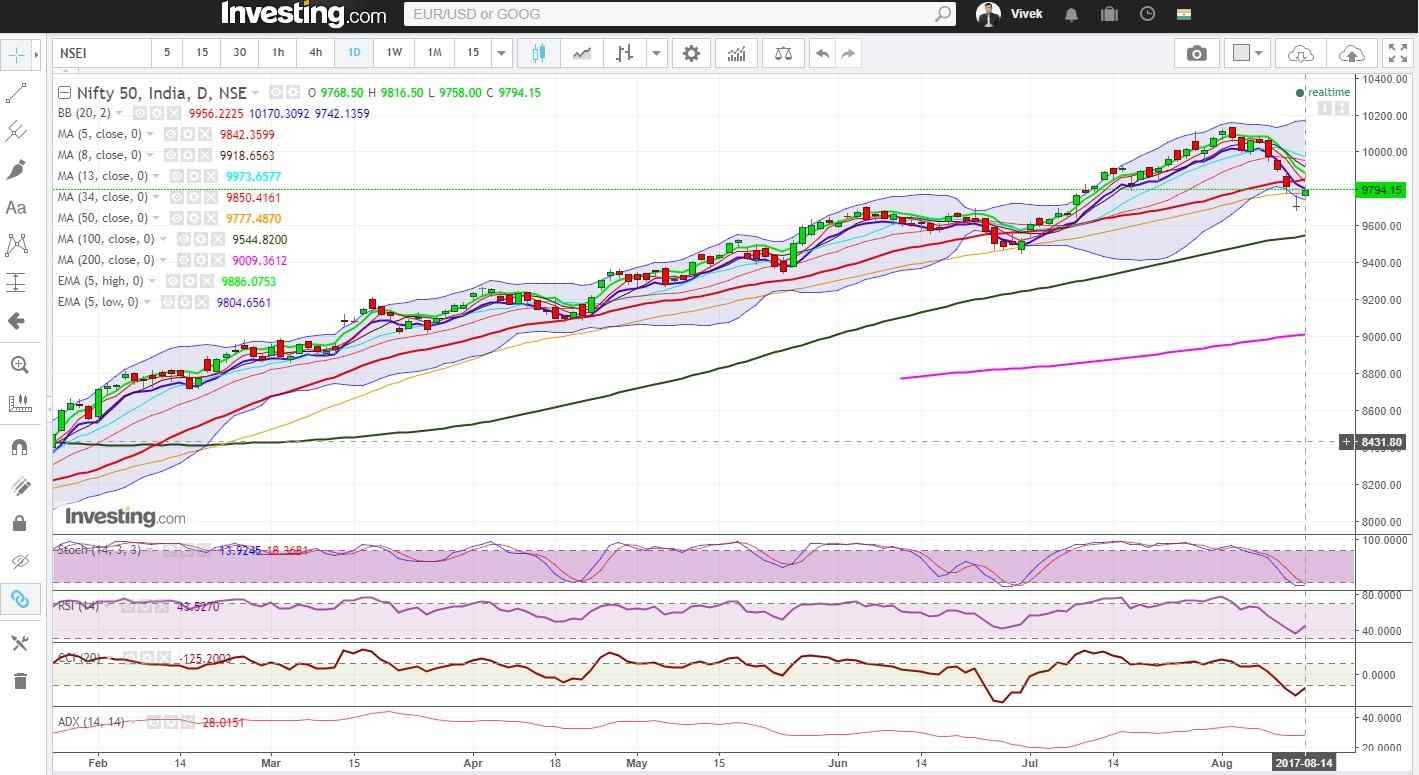
Nifty was up by 83.35 points in today’s trade. In daily time, though Nifty is able to close above 50 DMA (presently at approx. 9777.5), it could not close above the 5 day Low EMA (presently at approx. 9804.7)which is still a concern for bulls and may act as a resistance in the daily time frame. The market sentiment will turn bullish only if Nifty closes above 5 Day High EMA (presently at approx. 9886).
The next probable support in the daily chart remains at lower Bollinger line (presently at approx. 9742.1). On the upside, the probable resistance could be 5 Day Low EMA (presently at approx. 9804.7), 5 day moving average (presently at approx. 9842.40) and 5 Day High EMA (presently at approx. 9886.1).
Slow stochastic and RSI are still close to their lower bound Moreover; CCI is still below -100 line which suggest that bears are still having control in daily timeframe, in spite of today’s up move. Overall Nifty remains neutral to bearish in the daily time frame.

Figure: Nifty Daily Chart

Figure: Nifty Tech Table


