Nifty close 10806.50: Nifty is trading above 10800, company results supported the index to achieve this high. Previous resistance level was broken by Friday’s bullish candle and it seems that the index will cross 11000 very soon if the momentum stays intact.
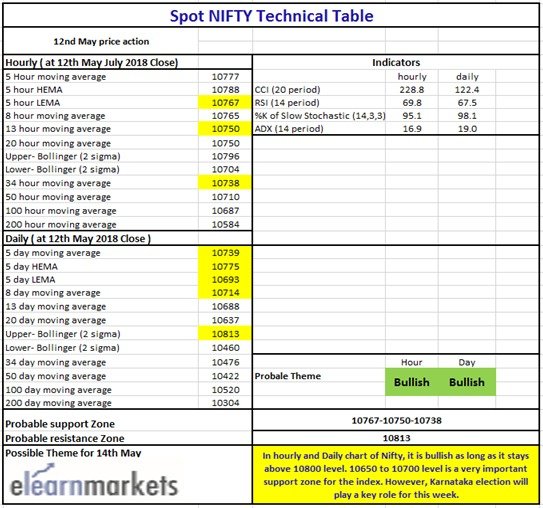
Hourly Technical
In the hourly chart, Nifty is trading above most short term moving averages. The probable support in the hourly chart comes at 13 Hour SMA (presently at approx. 10750) and 34 Hour SMA (presently at approx. 10738).
Upper Bollinger band (presently at approx. 10796) is broken, so there is less chance for the index to face any resistance for now. Hourly Stochastic is in the overbought zone while RSI is about to enter in its overbought level. CCI is trading above 200 level suggesting the index is in an overbought condition but the momentum is fully supporting this up move of the index. Overall, Nifty appears strong in the Hourly chart.

(Hourly chart)
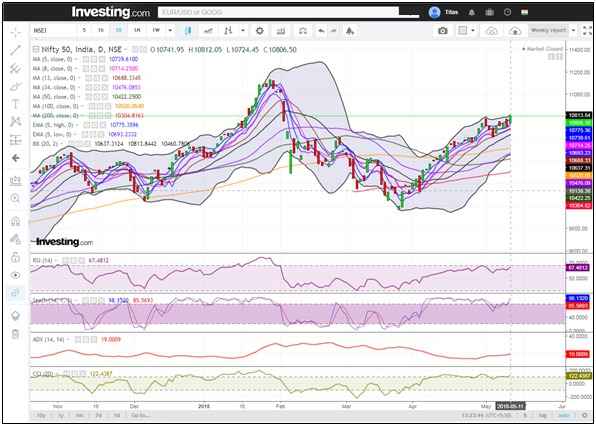
Daily Technical
In the daily chart Nifty is trading above previous swing high. Friday’s trading session helped the index to close above 10800 level. A strong green candle in the daily chart indicating bulls are about take control to push the index higher.
Nifty is trading above its 5 Day high EMA (which is approx. 10775). The only possible resistance would be upper Bollinger line (which is at 10813) for the next trading sessions. SMA 5 and 8 could become possible support for the index.
Indicator RSI is above 65 suggesting strong momentum while stochastic is in its overbought level. In case of CCI it is above 100 level and ADX about to cross its 20 line. Overall the index has the strength and the momentum to support it to trade higher.

(Daily chart)
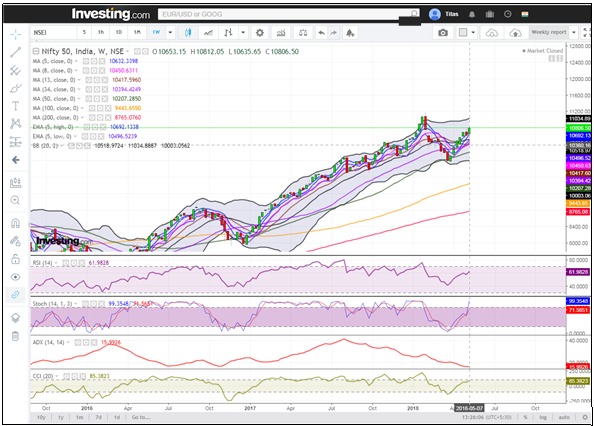
Weekly Technical
In the weekly chart nifty is trading above previous week high and it also filled up the gap which occurred 1st week of February. Results were the key factor for this week and from the chart we can see that they were positive.
Last week Nifty made a red candle but in this case a green candle with no lower shadow brings up the positive hope for the buyers.
Index is trading above its 5 DMA (presently at approx. 10632) and this is also its initial support. Upper Bollinger line could become Index’s next resistance level but for the next week level 11000 which is a psychological resistance level may create problem for the bulls.
Indicators RSI is above 60 level suggesting good momentum but ADX is trading flat. Slow stochastic %K is in the overbought zone and indicator CCI is below its 100 level. This is a mixed sentiment from the indicators, and this may happen because of this week’s Karnataka election. Overall election is going to be the deciding factor for this week.

(Weekly chart)
You can use stockedge app to get cutting edge over others in both short term trading and investing. Here you not only get data at one particular place but can also create your own combination scans based on your own technical and fundamental parameter. See the video below to know about various features in Stockedge app.

(Technical Chart)


