Nifty close 10596.40: Nifty ends this week with two consecutive red candles. Karnataka election is playing the major character behind this market downfall. Market has totally lost its previous positive momentum and now it is trading at an important support level (presently at approx. 10600). More downfall is expected.
Hourly Technical
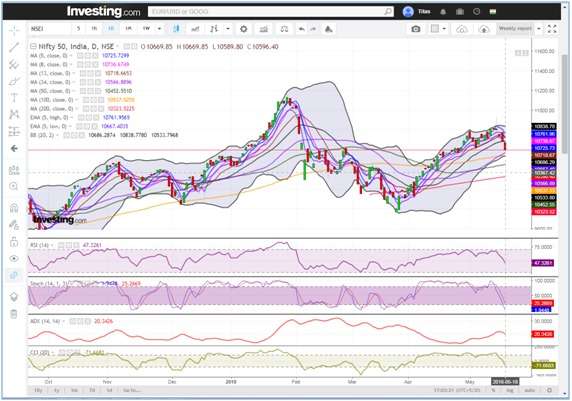
In the hourly chart, Nifty is trading below itsmost short term moving averages. The probable support in the hourly chart comes at lower Bollinger line (presently at approx. 10578) and this support level is very much important for the Index.
Mid Bollinger line (presently at approx. 10688) was broken by Tuesday’s trading session and it has become its initial resistance. 200MA (presently at approx. 10656) is also above the price line and it will also act as important resistance level.
Hourly Stochastic is in the oversold zone and the RSI is below level 30. CCI is trading below -100 level suggesting the index is in an oversold condition. ADX is high and it is above 30 level, indicating there is a chance for more downfall.

Hourly Chart
Daily Technical
In the daily chart of Nifty it is trading at an important support level. Consecutive two red candles made the market fall nearly 180points. However, there is a support of 200MA (presently at approx. 10537) line in the daily chart.
Most of the short term moving averages are above the price. Mid Bollinger line (presently at approx. 10686) could be a possible resistance zone for the index.
Indicator RSI is below its 40 level while stochastic is in the oversold level. In case of CCI it is just above -100 level and ADX is above 20 line. Overall the index is looking bearish for next few trading sessions.
Daily Chart
Weekly Technical
Nifty is above the mid Bollinger line in the weekly chart. Most of the moving averages are below the price line and it will create an important support level (approx. at 10500) for the index.
The week started with a positive note but Karnataka election changes the market direction and the momentum. Previous green candle is totally covered up by the latest red candle and more down fall is expected.
Index is trading below its 5 DMA (presently at approx. 10655). Mid Bollinger line (presently at approx10522) will be the most important support level for the next week. If Nifty breaks the 10450-10500 level then more down fall is expected.
Indicators RSI is about to cross 55 level from abovesuggesting change in momentum but ADX is trading flat. Slow stochastic %K is in the normal zone and indicator CCI is below its 100 level. Over all for next few trading session this negative sentiment can be continued.
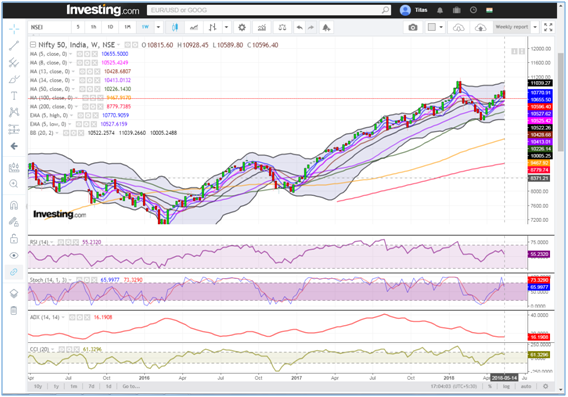
Weekly Chart
You can use stockedge app to get cutting edge over others in both short term trading and investing. Here you not only get data at one particular place but can also create your own combination scans based on your own technical and fundamental parameter. See the video below to know about various features in Stockedge app.
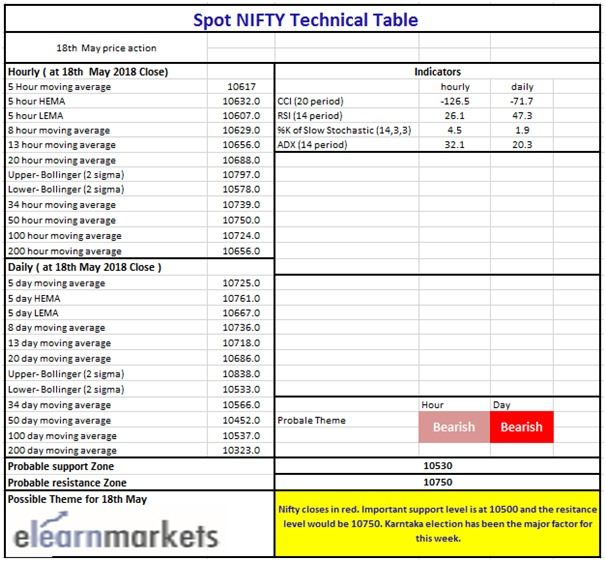
Technical Table


