Nifty close 10821.85: Last hour trading session makes Nifty to ends in a positive note. Sudden buying pressure in the pharma, banks and Fin service sectors pulls the market up. But this does not suggest any bullish move for near future; Nifty is still trading in a range bound zone in Daily as well as in Weekly chart. This is the 5th time Nifty ends by making a Doji candle in the weekly chart.
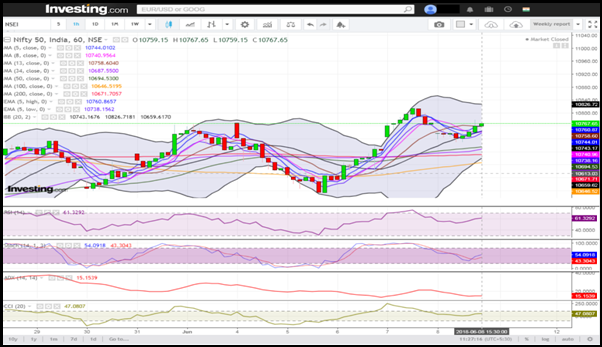
Hourly Technical
As we can see in the chart, in the last hour Nifty make big bullish candle which pulls the market approximately 70 points up. But still the market sentiment is not suggesting any possible uptrend. From the chart we can understand that the Market is in a range bound zone (approx.10700 to 10800).
Because of the last hour buying pressure all indicators indicating bullish sentiment. Indicator RSI is above 60, Stochastic has just entered into its overbought territory (presently at approx. 88), ADX is moving up and about to cross its level 20. CCI is above 200.
Overall in the hourly chart the sentiment is very bullish but the market is still in a range bound zone. A gap up opening on Monday may define a new uptrend if the momentum stays intact; otherwise we might see another range bound trading for next week’s trading session.
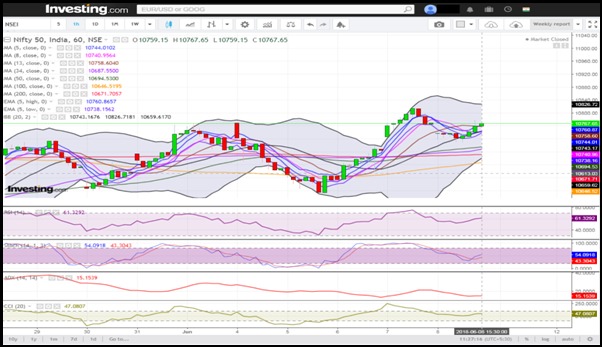
(Hourly chart)
Daily Technical
From the Daily chart of Nifty we can see, the market has just recovered from the previous day’s downside. But the range is still intact.10700 to 10800 is being the very crucial zone for the index.
Indicators are suggesting the same, RSI is above level 55, Stochastic about to enter in the overbought level (currently at approx. 79), ADX is falling (presently at approx. 11) and the CCI is below 100.So It is clearly visible there is no strong indication from the indicators.
Overall from the daily chart we are expecting range bound trading for next week. If the market cross its above swing high (presently at approx. 10893) and close above it, a possible upside may be witnessed. Good thing for the market is that maximum number of moving averages are below the price and they might act as possible support.
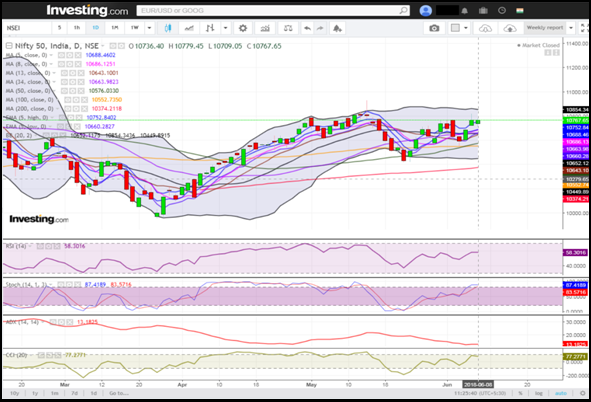
(Daily chart)
Weekly Technical
This is the 5th consecutive week where we are witnessing Doji candle in the weekly chart. There is no upside or down side sentiment visible from the chart. As we can see from the chart Candlestick’s price action is very weak market is just trying to recover the downside slowly.
Let’s discuss the indicators,
RSi is above 60 but trading flat, Stochastic has gone in its overbought level, ADX is also trading flat (presently at approx. 15.99) and CCI is just above the 100 level but sloping downward.
There is no significant move visible from the chart, only one positive thing we can see that the moving averages are below the price, which will act as a decent support levels. There is very less chance for the down side but not any clue for upside move also. Until the Nifty is closing above 10900 it will be range bound and if it cross this level a new high is possible.
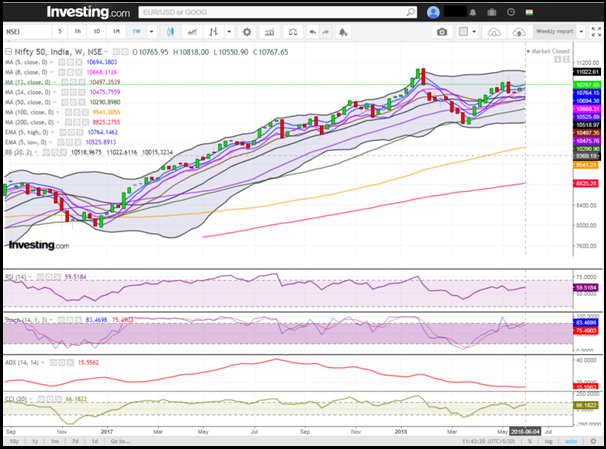
(Weekly chart)
You can use stockedge app to get cutting edge over others in both short term trading and investing. Here you not only get data at one particular place but can also create your own combination scans based on your own technical and fundamental parameter. See the video below to know about various features in Stockedge app.
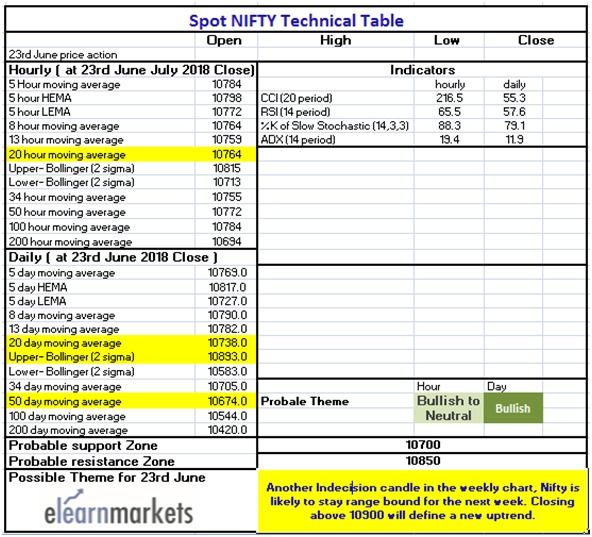
Elearnmarkets Technical Table


