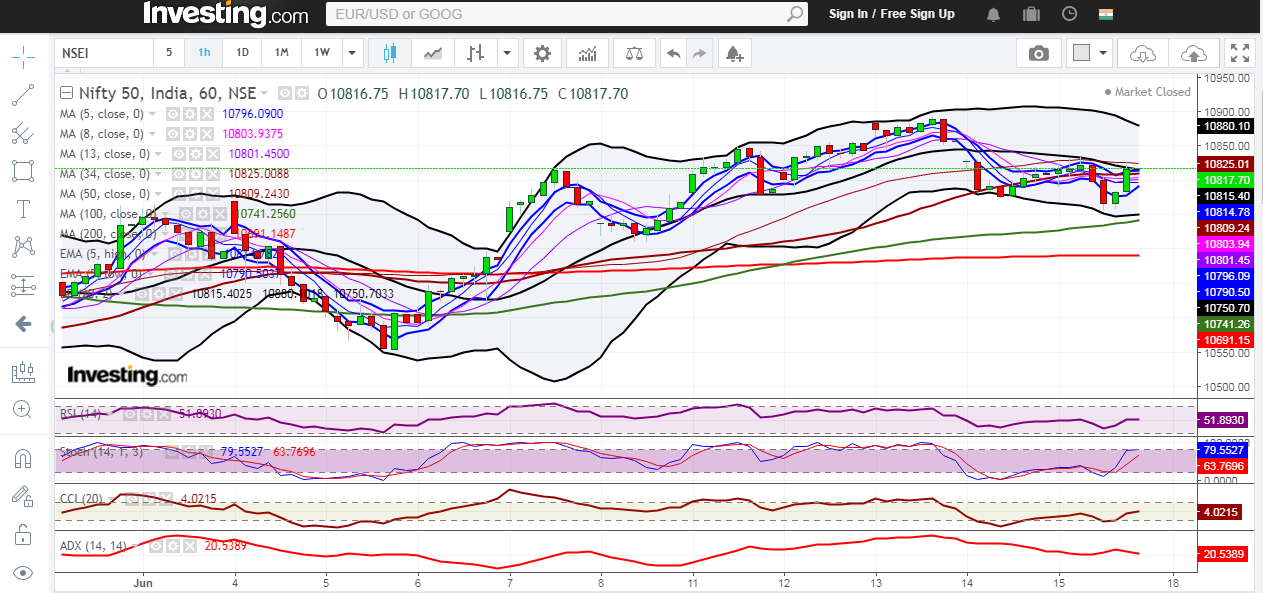
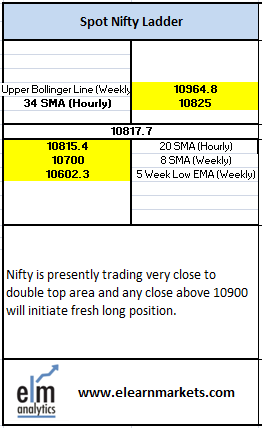
Nifty close 10817.7: Nifty faced resistance from the double top area in the daily chart after which it witnessed some correction. Presently, the index has closed within the 5 Day High-Low EMA band which suggest some consolidation, however any close either side of the band will decide the fresh move for the index in the coming days.
Hourly Technical
In the hourly chart, Nifty is trading just below the mid Bollinger line which may act a strong resistance. Any close above 34 Hour SMA (presently at approx. 10825) may initiate fresh long . The probable support in the Hourly chart comes at 5 Hour SMA (presently at approx. 10796) and 100 Hour SMA (presently at approx. 10741.2)
On the other hand, Nifty may resistance at 34 Hour SMA (presently at approx. 10825).
Hourly RSI and CCI are in the normal zone while Stochastic is trading very close to the overbought area. However, ADX is coming down indicating lack of weakness in the hourly timeframe.
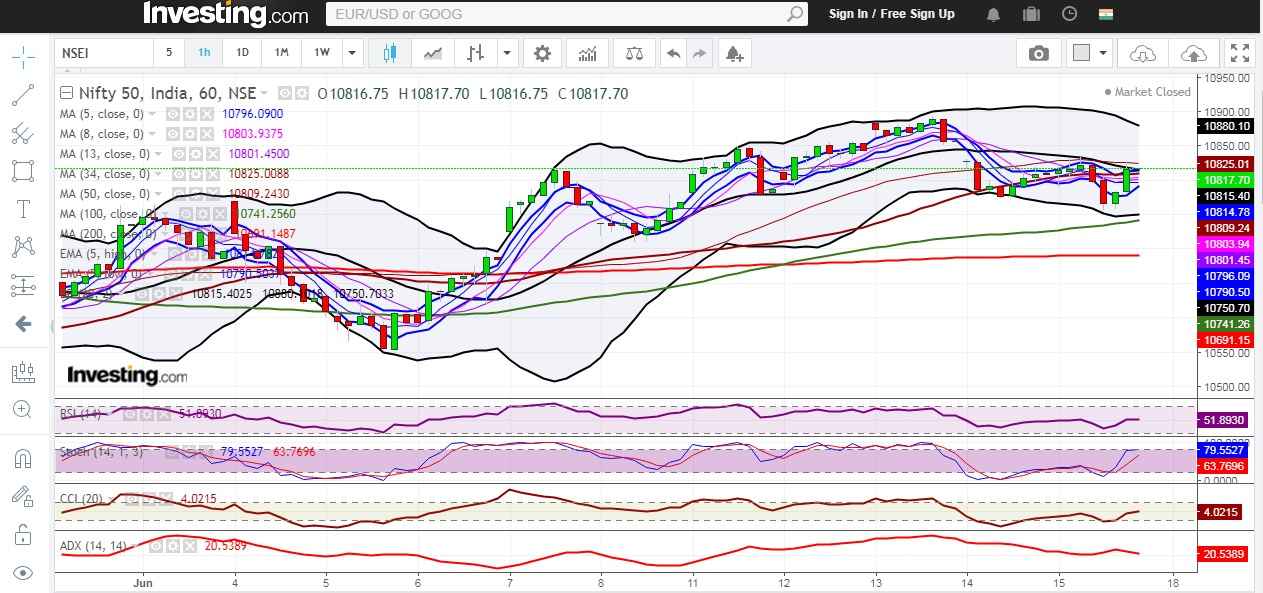
Hourly chart
Daily Technical
In the daily chart, Nifty has made a hammer pattern on strong volumes but at the same time trading very close to the double top area. Any close above 10900 may take Index to new highs.
Daily Stochastic is trading in the overbought area while RSI and ADX are trading very close to the upper bound of their respective ranges. Overall, Nifty remains strong as per the technical parameters.
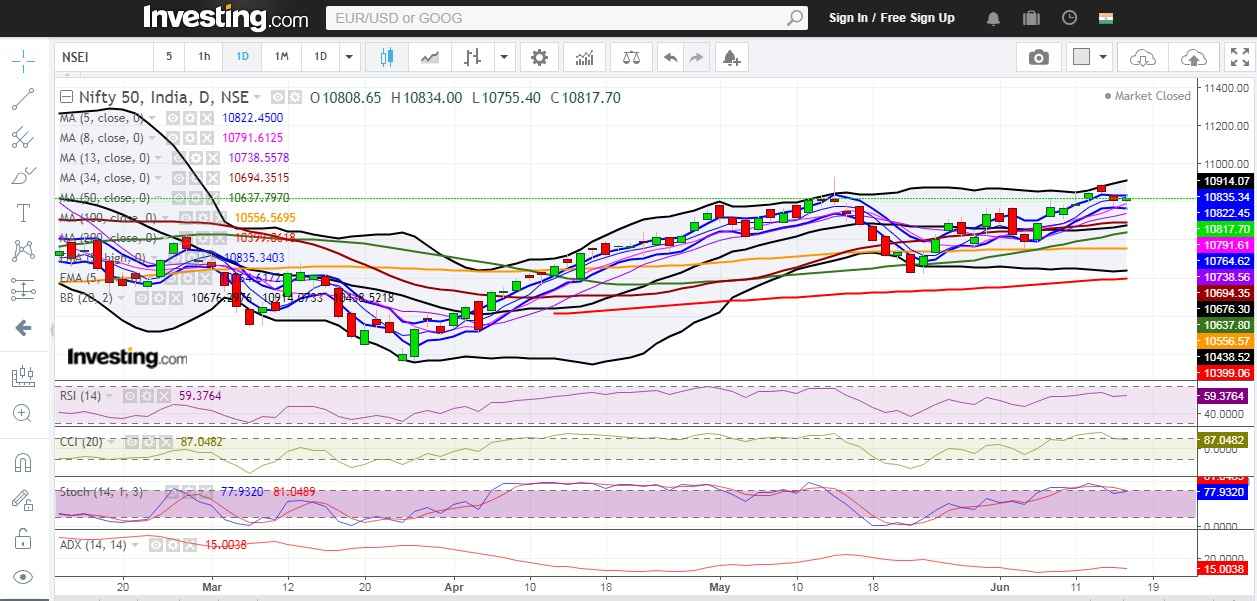
Daily Chart
Weekly Technical
In the weekly chart, Nifty has closed above most moving averages and also above 5 week high EMA suggesting strength. Weekly CCI and Stochastic has closed in the overbought zone while RSI has just trading below the overbought area. Overall , Nifty looks strong as per the technical parameters in the weekly timeframe.
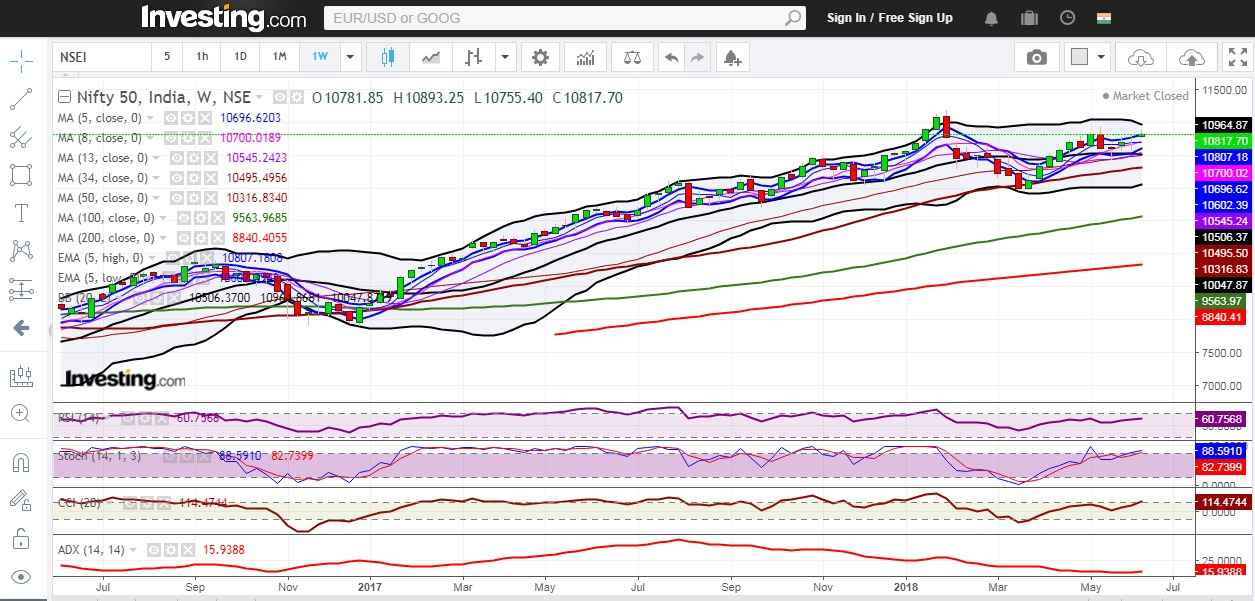
Weekly Chart
ELM Matrix


