Nifty close 10184.9: Nifty made a Doji pattern in the daily chart suggesting tough fight between the bulls and bears and closed below the psychological 10200 mark.
Hourly Technical:
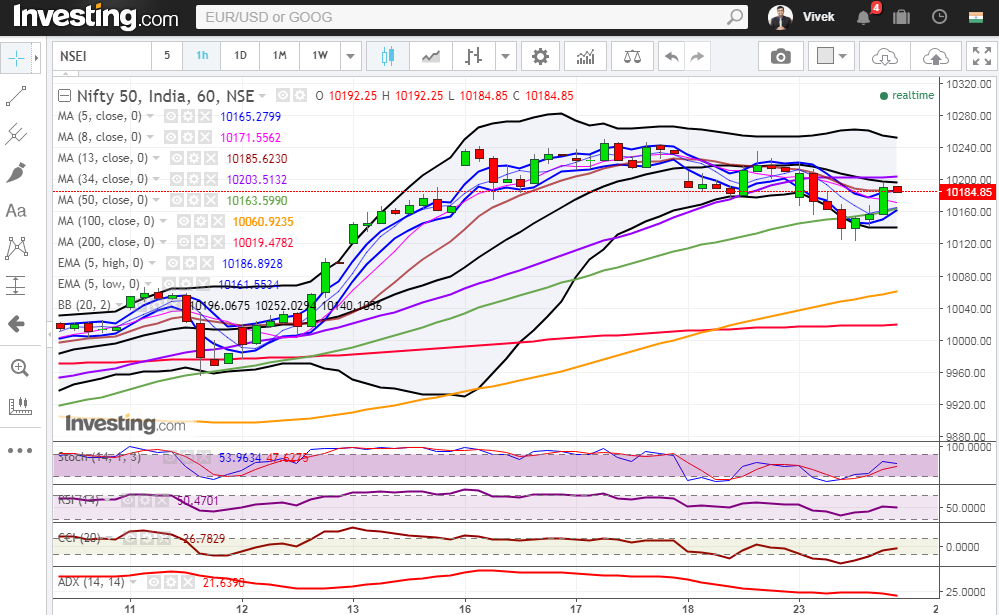
In the hourly chart, Nifty recovered in the second half after a sharp decline in the first half of the trade. The probable support in the hourly chart comes at 5 Hour moving average (presently at approx.10165.3) and Lower Bollinger line (presently at approx.10140.1).
On the upside, Nifty may face resistance at 34 Hour moving average (presently at approx. 10203.5) and Upper Bollinger line (presently at approx.10252).
Hourly CCI, RSI and Stochastic are in the normal zone while ADX is downward sloping suggesting loss of momentum. Overall Nifty remains neutral in the Hourly chart.
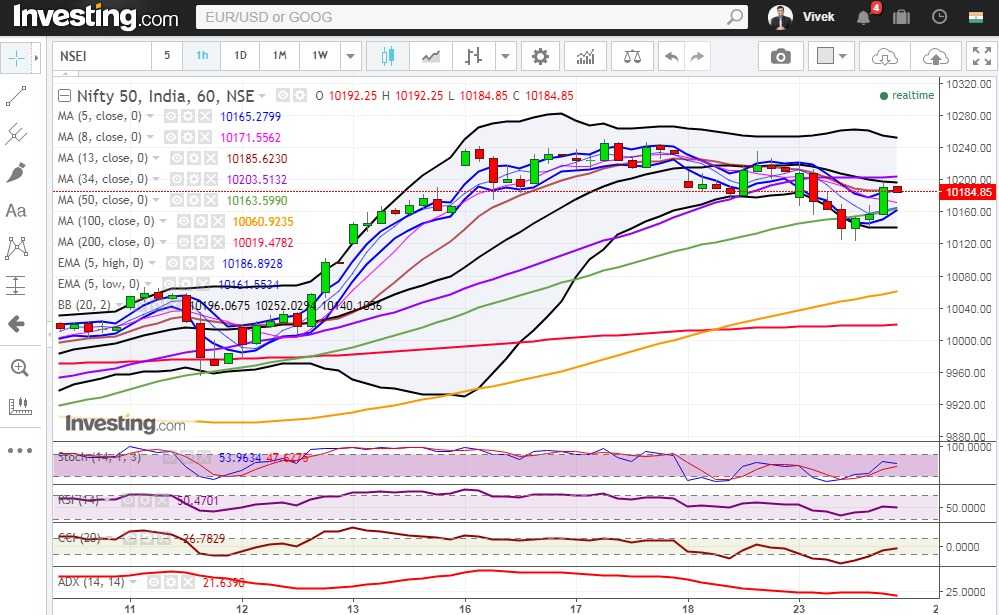
Figure: Hourly Chart
Daily Technical:
In the daily chart, Nifty consolidates near its 10200 mark and remains within the 5 EMA High-Low band suggesting consolidation. The break on either side of the band will decide the fresh move of Nifty in coming days.
The probable support in the daily chart comes at 8 DMA (presently at approx.10157) and 5 Day low EMA (presently at approx. 10128.6).
On the upside, Nifty may face resistance at 5 day high EMA (presently at approx. 10209.7).
Daily Stochastic is in the overbought zone while Daily RSI and CCI are trading near its upper bound of their respective range. The ADX is still moving downward suggesting loss of momentum. Overall Nifty remains neutral to bullish in the daily chart.
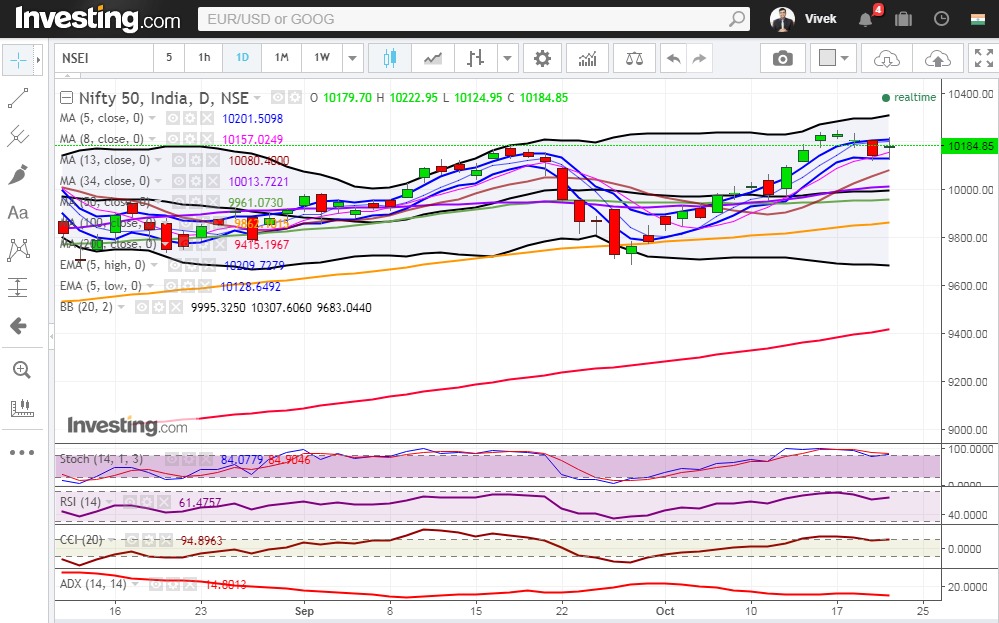
Figure: Daily Chart
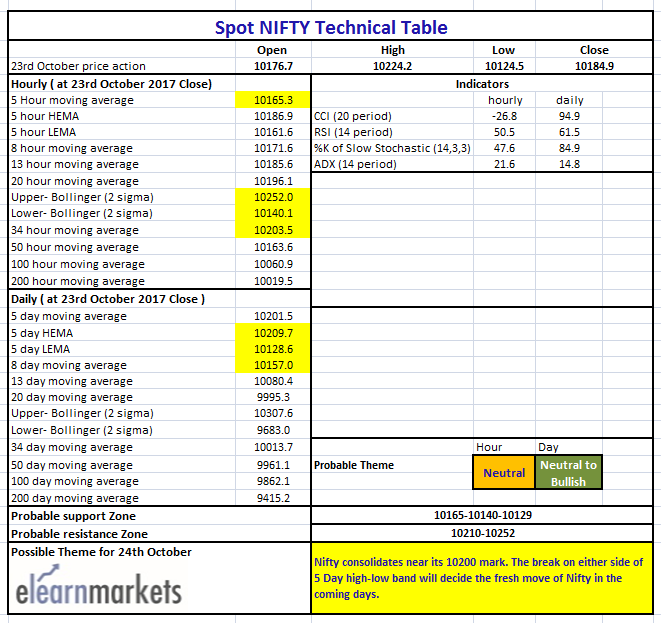
Figure: Tech Table


