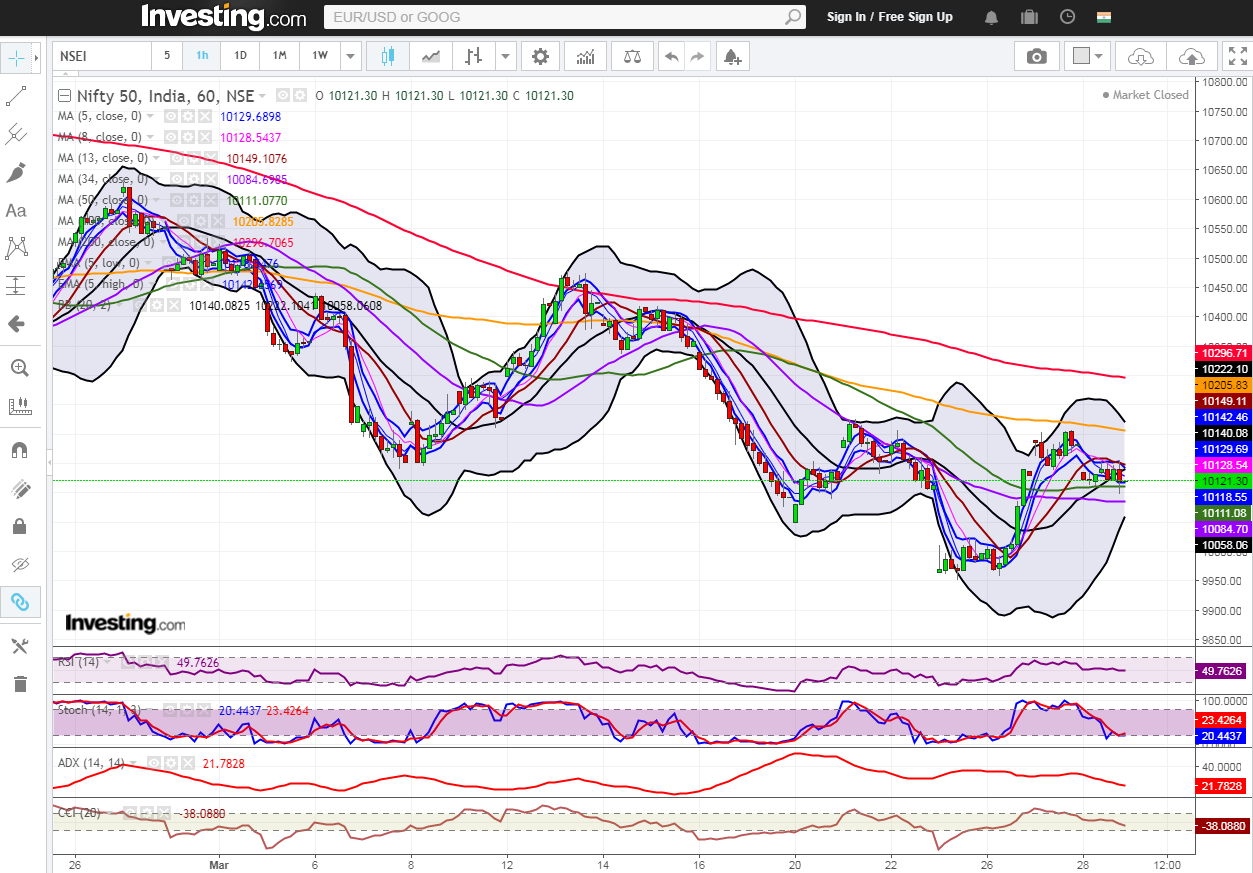
Nifty (Weekly close approx. 10113.7): Nifty ended above the psychological level of 10000 ahead of long weekend and saw some buying on Monday’s session amidst high volatility.
Presently Nifty is trading at very crucial levels in the weekly chart and based on various factors like domestic political uncertainty, the scams in the PSU banks, US policy on trade and increased yield in economy tends to pose great risk for market over the next one year period and one cannot negate the weakness and uncertainty in the index.
Hourly Technical
In the hourly chart, Nifty is trading below most short term moving averages. The probable support in the hourly chart comes at 34 Hour moving average (presently at approx. 10093) and lower Bollinger band (presently at approx. 10003).
On the upside, Nifty may face resistance at 5 Hour moving average (presently at approx. 10145) and 100 Hour moving average (presently at approx. 10214).
Hourly RSI and CCI are in the normal zone of their respective zone while Stochastic is trading very close to its lower bound. Moreover ADX is a still coming down indicating loss of momentum. Overall, Nifty remained bearish to neutral in the Hourly chart.
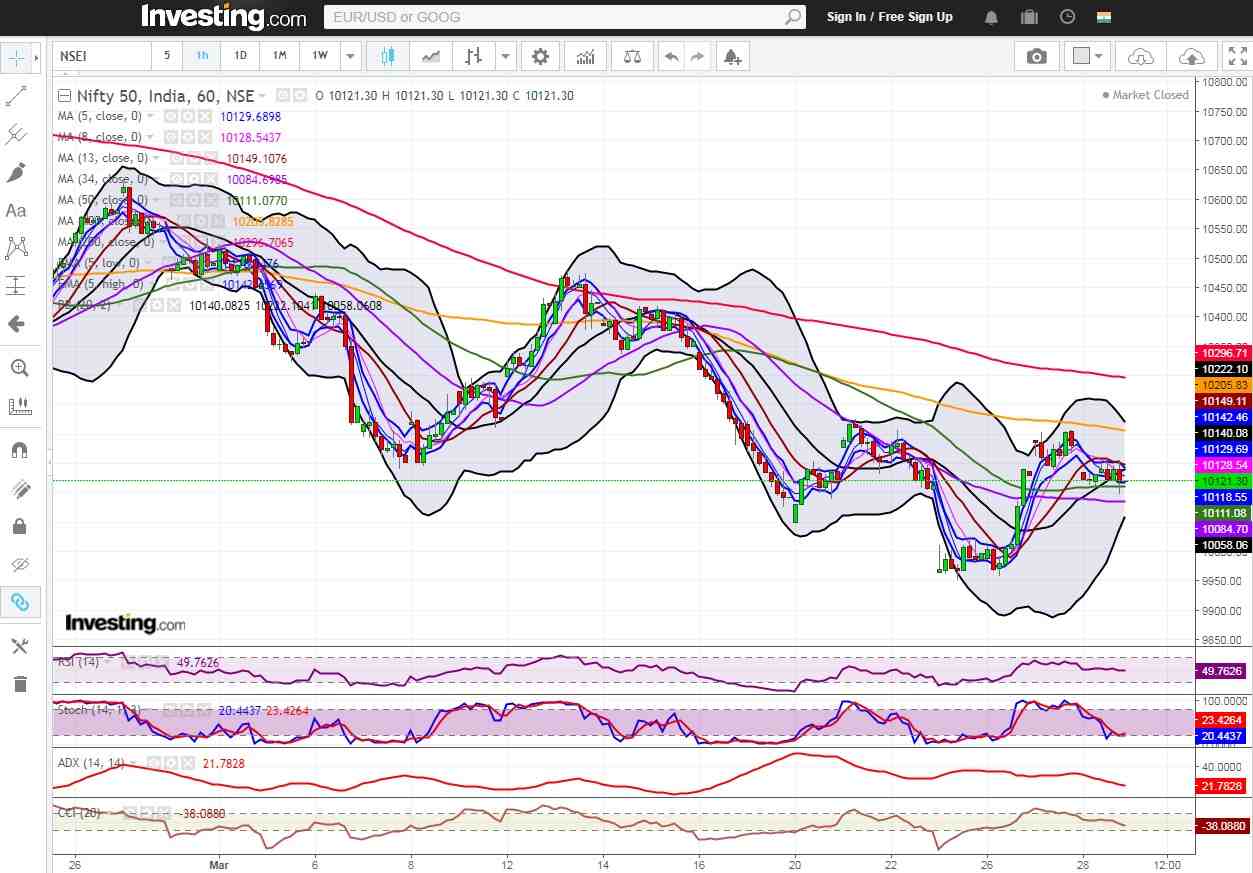
Hourly chart
Daily Technical
In the daily chart, soon after the Nifty broke important support of 200 DMA on adverse global cues of US-China trade war, the index saw some pullback in the last week. However, on the last day on Wednesday, the index saw gap down on heavy volume which suggest weakness in the daily time frame.
The probable support in the daily chart comes at 5 Day Low EMA (presently at approx.10079) and Lower Bollinger band (presently at approx.9965).
On the upside, Nifty may face resistance at 5 Day high EMA (presently at approx.10171) and 20 Day SMA (presently at approx. 10245).
Daily Stochastic, CCI and RSI are trading very close to the lower bound. Overall, Nifty remained neutral to bearish in the daily chart.
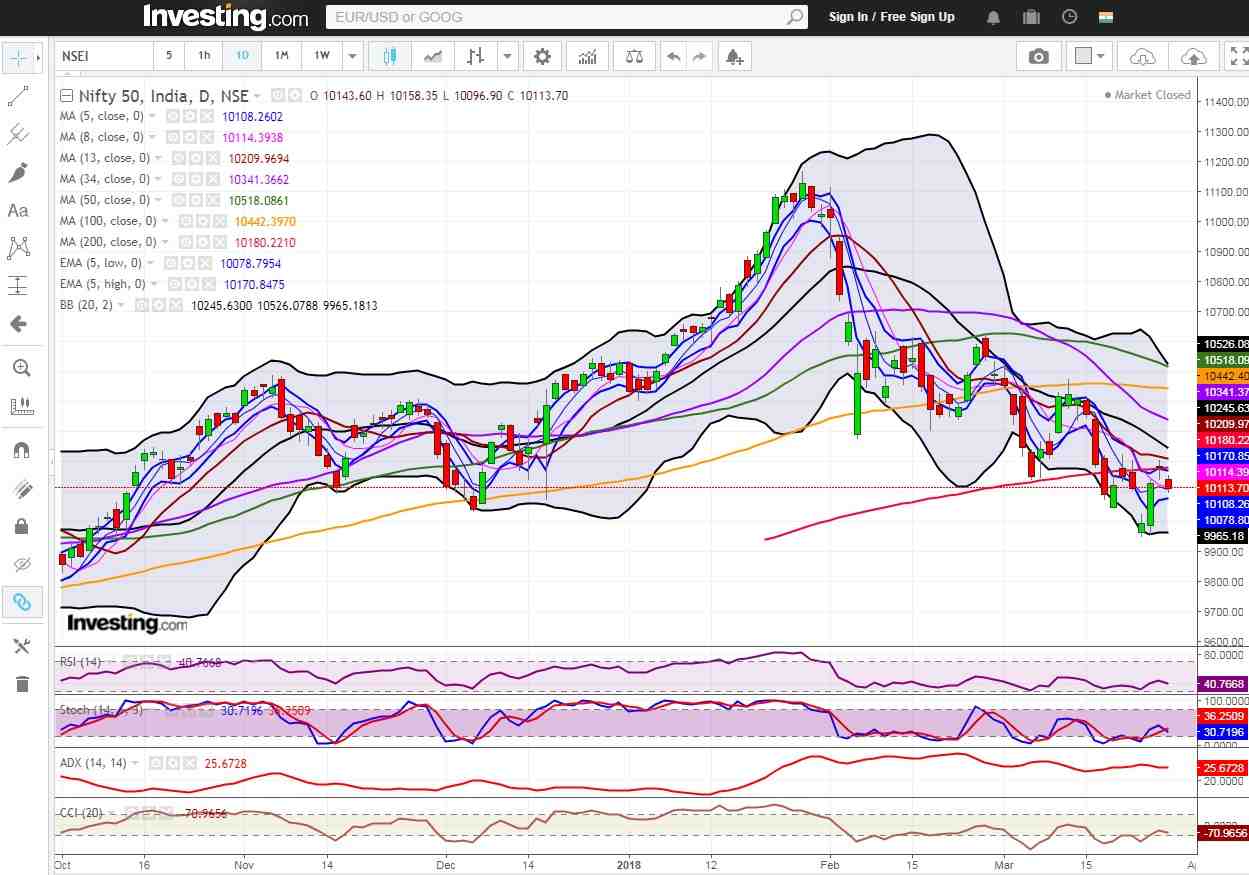
Daily Chart
Weekly Technical
In the weekly chart, Nifty took support from the 50 Week SMA (presently at approx.10060) and closed above this level in the last week. It seems that market have already discounted all the negatives at the present levels but break below the psychological level of 10000 may take Nifty to 9700 and 9500 levels which might act as a very strong support for the index in the coming days. The convergence of the support line and the uptrend line comes at 9700 and it if we see the retracement from 6800 to 11170, 38.2% retracement comes at 9500 levels which would be important levels to watch out for if Nifty further corrects from the current levels.
Weekly CCI and Stochastic are in the lower bound of their respective range while RSI is in the normal zone. Moreover, the index bound from the 40 levels of RSI which might suggest that the correction is over and we may soon see some reversal or the market may continue to be choppy at these levels for couple of months. Overall, Nifty remained neutral in the weekly chart.
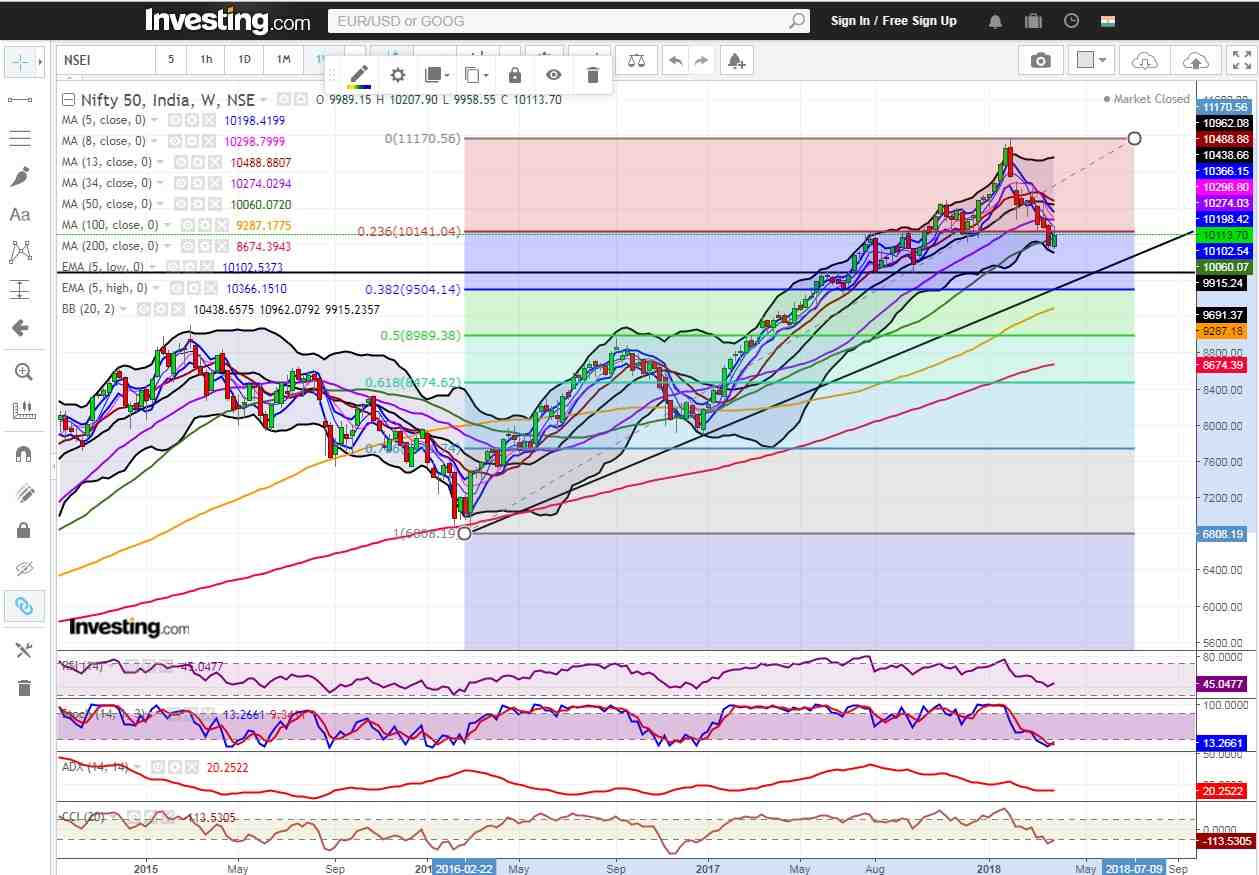
Weekly Chart
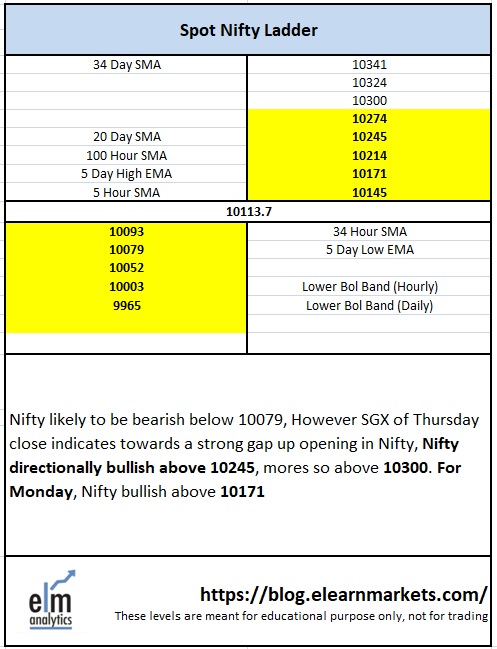
Nifty ELM matrix


