Elearnmarkets - Financial Market Learning
  • Courses
  • Webinars
  • Stories
  • Language
    • English
    • Hindi
    • Bengali
No Result
View All Result
Get Free Course
  • Basic Finance
  • Derivatives
    • Futures
    • Options
  • Financial Planning
  • Fundamental Analysis
  • Technical Analysis
  • Mutual Funds
  • Marketshala
  • Miscellaneous
Elearnmarkets - Learn Stock Market, trading, investing for Free
  • Courses
  • Webinars
  • Stories
  • Language
    • English
    • Hindi
    • Bengali
No Result
View All Result
Get Free Course
Elearnmarkets - Learn Stock Market, trading, investing for Free
No Result
View All Result
Home Technical Analysis
How to trade Megaphone Pattern

How to trade in Megaphone Pattern?

Elearnmarkets by Elearnmarkets
December 3, 2024
in Technical Analysis, Charts, Patterns & Indicators
Reading Time: 10 mins read
15
66.4k
VIEWS
Share on FacebookShare on XShare on WhatsApp

Key Takeaways:

  • Megaphone pattern is a pattern that consists of minimum of higher highs and two lower lows.
  • The pattern is generally formed when the market is highly volatile in nature and traders are not confident about the market direction.
  • Megaphone pattern is known to give multiple trading opportunities to the trader.
  • This pattern also can be traded when it fails but is necessary to identify the failure perfectly.
  • Sometimes only pattern is not enough to take best trading decisions you may need multiple indicators to identify better entry and exit points

Do you know what traders trade?

What exactly do they look for in the charts?

The answer is Pattern.

A technical analyst who is willing to trade will always search for a pattern in the chart. In this article, we will discuss trading with megaphone patterns.

But why?

Basically, a trading pattern is one of the easiest ways to trade because they will always have certain entry and exit points. What we have to do is just identify the pattern perfectly.

In this topic, we are going to discuss a pattern which is about 85 years old and first mentioned by Richard Schabacker’s 1932 book: “Technical Analysis and Stock Market Profits,”. The pattern which looks like a megaphone is seen in a trending market.

There are various nicknames for this pattern like Broadening wedge and Inverted Symmetric triangle. But in this topic, we will name it as the Megaphone pattern.

Table of Contents
What is Megaphone Pattern?
How to identify the Megaphone pattern?
Characteristics of Megaphone trading pattern
Theoretical ways to trade the Megaphone pattern
Breakout Trades
Swing Trades
Failures

What is Megaphone Pattern?

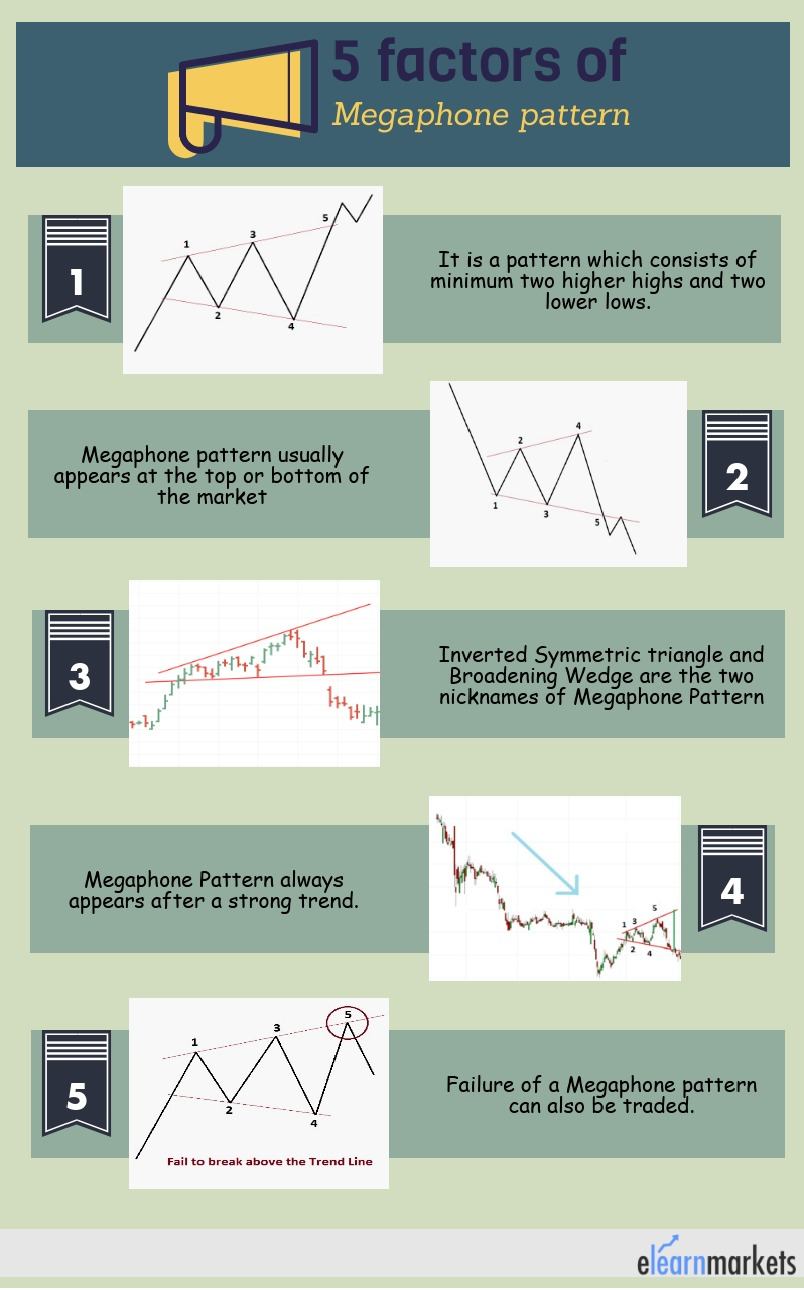
A megaphone pattern is a pattern that consists of a minimum of two higher highs and two lower lows. The pattern is generally formed when the market is highly volatile in nature and traders are not confident about the market direction. Normally this pattern is visible when the market is at its top or bottom. The greater the time frame is better the pattern will work. However, traders love this pattern when it is formed in a daily or weekly time frame.

To get a better idea of different aspects of technical analysis you may do:  NSE Academy Certified Technical Analysis

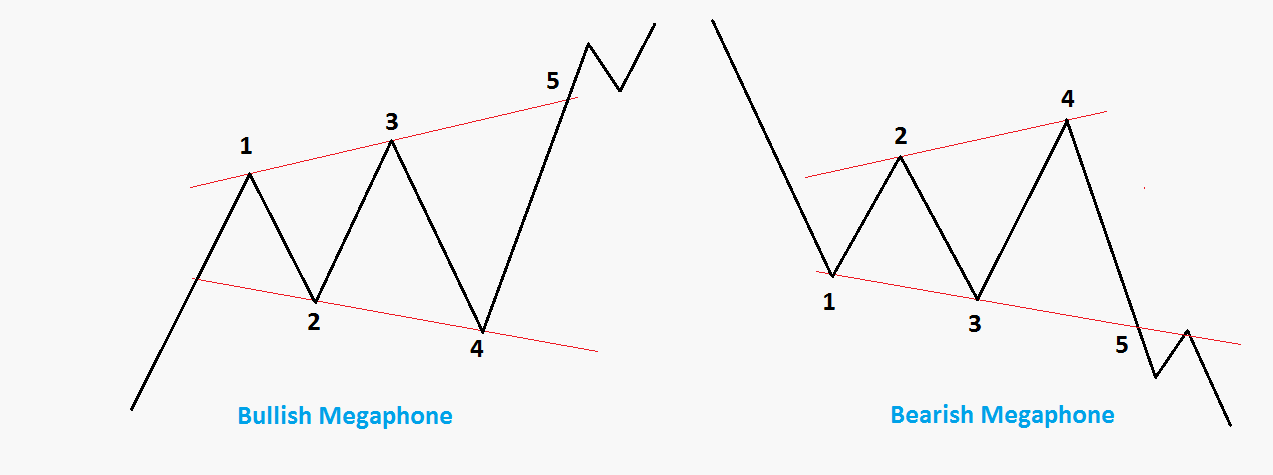
Have a look at this picture. These are the idle Megaphone Pattern.

Example of Megaphone Pattern

How to identify the Megaphone pattern?

Generally, the Megaphone Pattern consists of 5 different swings. But the swing has to have a minimum of two higher highs and two lower lows. A trend line is drawn by connecting point 1 and point 3 while points 2 and 4 are also joined together to draw a line.

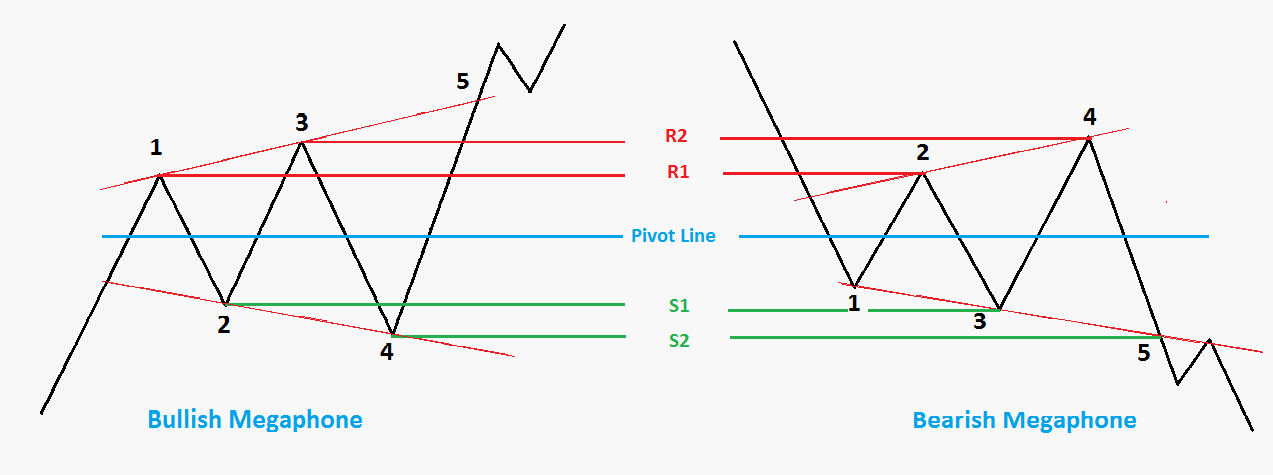
These two lines create a shape that looks like a megaphone or inverted symmetric triangle. These swings’ highs and lows have to close above or below its pivot line and therefore they will create swing high as pivot high (R1, R2, and R3) and swing lows as pivot lows (S1, S2, and S3).

A breakout occurs when the line does not respect its support or resistance line and closes outside the shape after making the 5th swing.

bullish & bearish pattern

Characteristics of Megaphone trading pattern:

Below are a few characteristics of the Megaphone trading pattern:

Volume:

Volume plays an important role when it comes to the recognition of this pattern.

In the Megaphone Top, volume usually peaks along with prices.

An increase in the volume, on the day of the pattern confirmation, is a strong indicator.

Underlying Behavior:

When the pattern is forming it represents that the bulls and bears are fighting to build control of the stock.

The pattern takes place when the bulls take the prices higher.

At the time of formation of the Megaphone Top, then again, bears make the prices fall because of which lower lows are formed.

However, the bears ultimately triumph.

Price Targets:

The target price refers to the potential price move that this pattern shows.

You can think about if the target price for this pattern is enough to supply an appropriate comeback after your costs (such as commissions) have been taken into account.

An ideal rule of thumb is that the target price should be greater than 5%, nevertheless, you should consider the existing price if the trade is going in your favor.

Theoretical ways to trade the Megaphone pattern:

Megaphone pattern is known to give multiple trading opportunities to the trader.

A trader can trade Megaphone pattern as

  • Breakout Trades
  • Swings trades (while making higher highs and lower lows)
  • When the Price fails to give a breakout.
How to trade in Megaphone Pattern? 1

Breakout Trades:

When the price breaks the trend line after making the 5th swing and closes outside the pattern, a breakout is confirmed. Breakout may happen in a positive or a negative direction. Depending upon the market condition and the position of the pattern in the chart, bullish and bearish breakouts happen.

Example of Continuation pattern

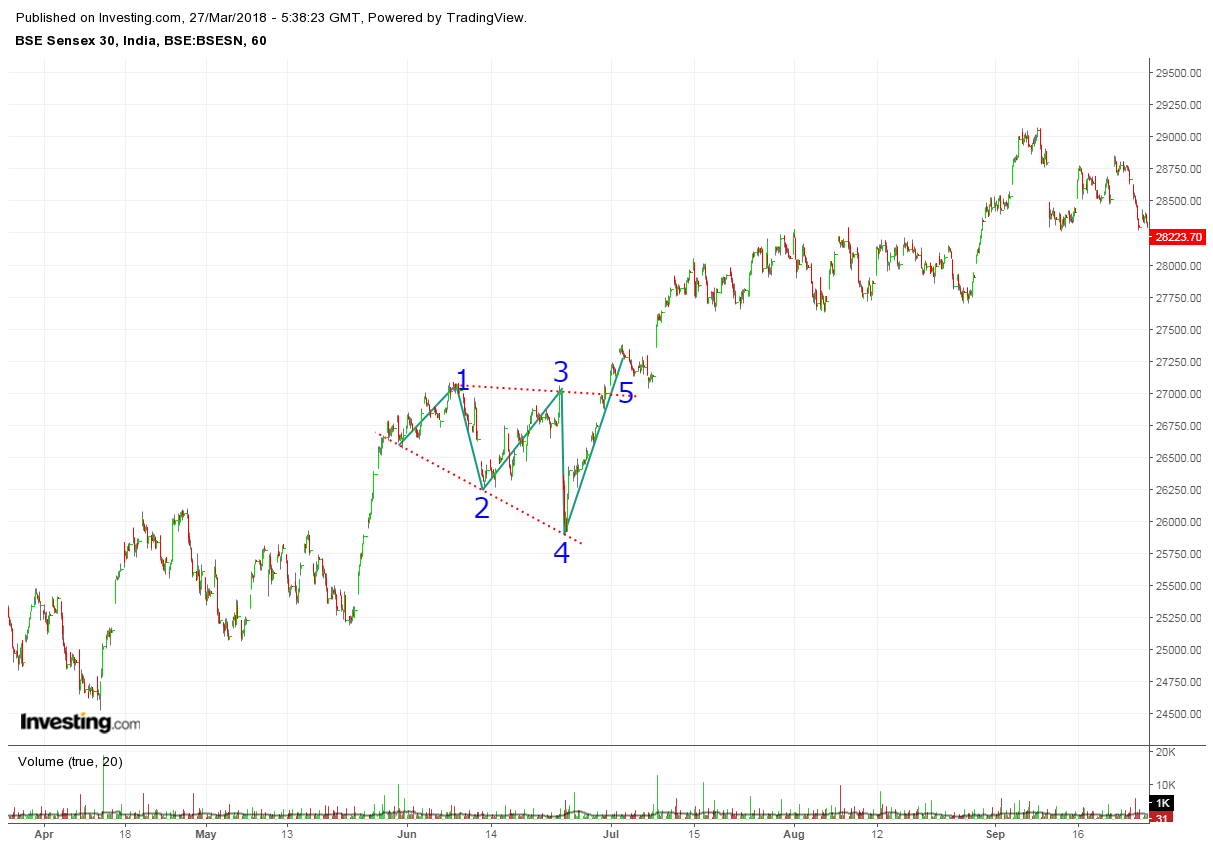
This is the chart of July 2016 Sensex. As we can see the market was in a strong uptrend. From the beginning of June, the pattern started taking shape and finishes in one month. The trend remains in an upward direction after the price breaks the upper line of the pattern (point number 5).

After a prolonged bull run, when this pattern is formed at the top and the price closes below its lower trend line, then it acts as a trend reversal pattern.

But, if the price closes above the higher trend line and makes new higher highs in the chart then it will be termed as a Continuation Pattern. Traders can take a trade when the price closes outside the pattern (in whichever direction) to get the best possible confirmation of the breakout.

Swing trades:

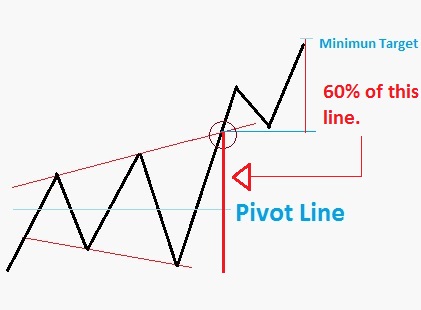
Though this is a Geometrical pattern, it has a tendency to respect Fibonacci levels. Respecting and maintaining Fibonacci levels without respecting Pivot lines is not possible. So it is obvious that this pattern will have a certain line which will be its pivot line and accordingly resistance and support lines will also be there in that pattern.

pivots line

For long trades, RI and R2 may act as a probable resistance while S1 and S2 may act as a probable support for a short position.

In case of breakouts finding the target is a bit tricky. Because it is nearly impossible to find out the perfect exit. But there is a way to make an exit. Generally, traders calculate the distance between two trend lines from the point it breaks and books partial or full profit when the price reaches 60% of that Redline (upside or downside) as shown in the figure.

pattern Target
Bearish pattern

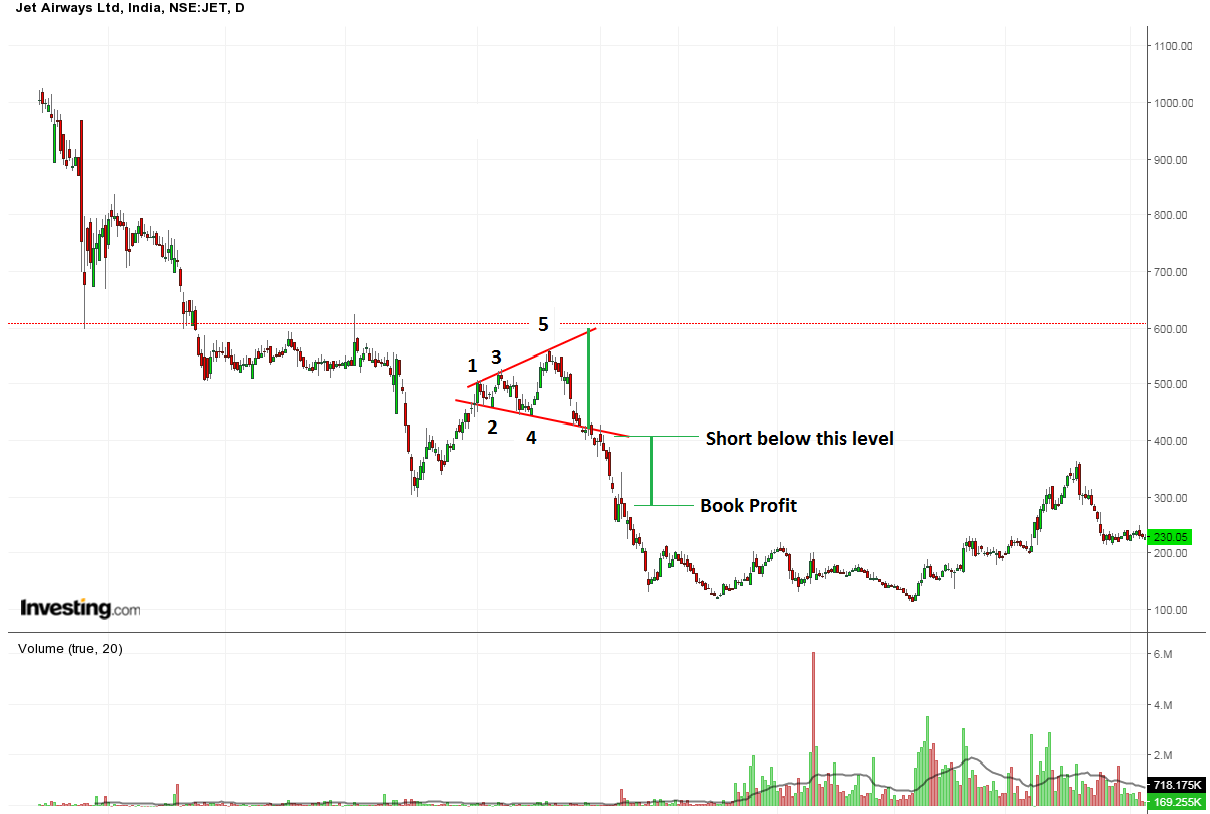
This is the Daily chart of Jet Airways. After a downtrend Megaphone pattern forms. The green line (1) indicates the length of the gap of the Resistance and support line. Line number 2 is the nearly 60% of that gap line (1), where we can book our profit.

Failures:

This pattern also can be traded when it fails but is necessary to identify the failure perfectly. Now how to spot the failure?

pattern targets

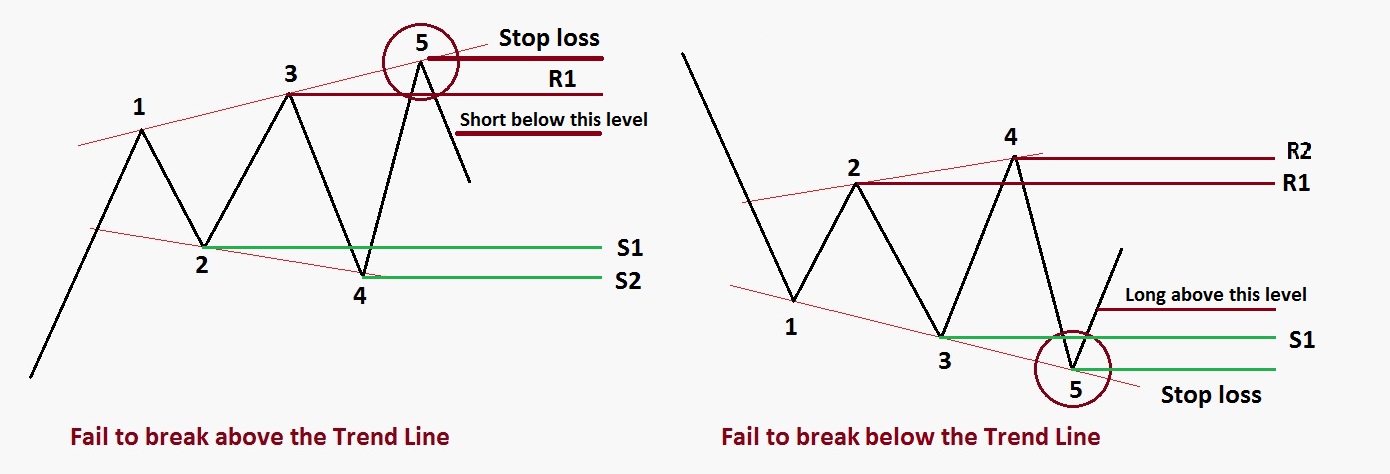
A failure can be spotted when it fails to break the trend line (upper or lower as the case may be) after completing the 5th swing.

Suppose in a bull market condition, this pattern is formed and if it fails to break the upper trend line, traders go short when the price goes below 3rd swing high (R2).

Similar is the scenario, when the market is in a bear phase and it fails to break the lower trend line (S2), traders take a long position when the price closes above the 3rd swing high.

pattern failure

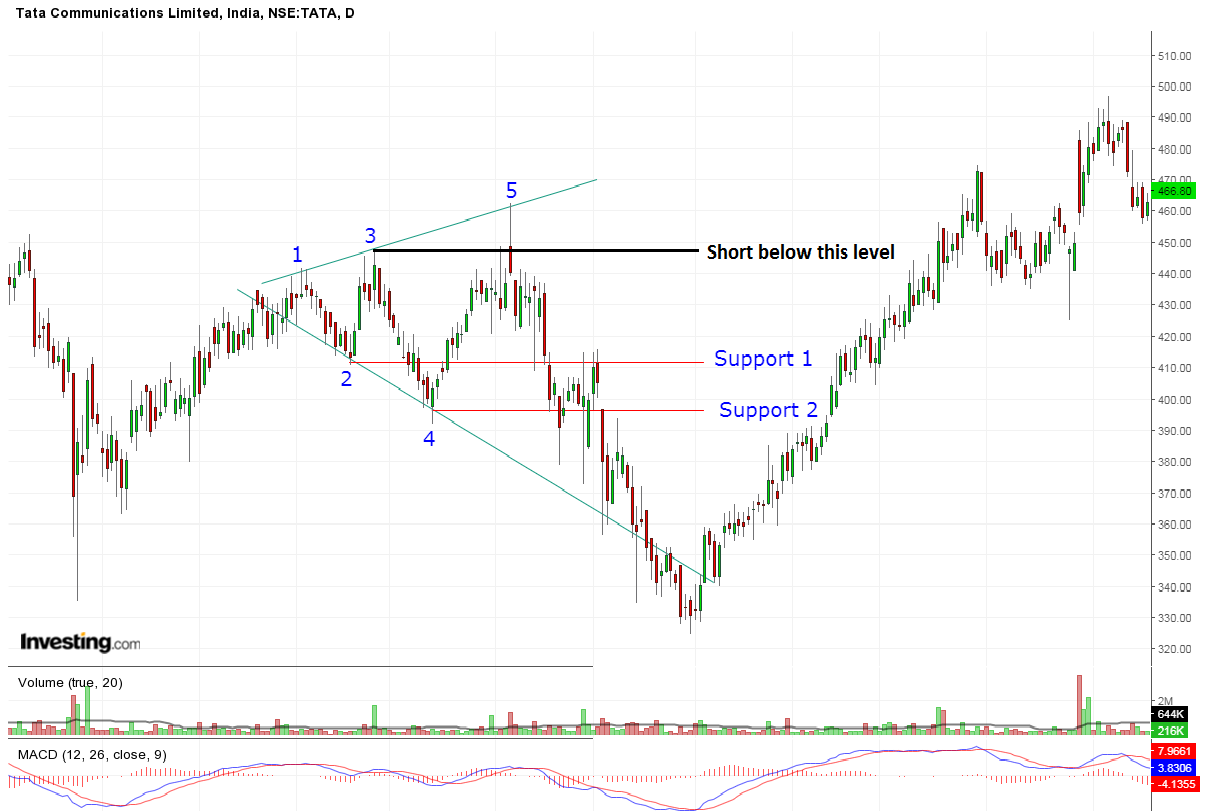
Here is the chart of TCS we can see that every time price is respecting its supports zone and beautifully follows the trend line. When the price is unable to break its resistance line (Upper line connected by points 1, 3, and 5) after the 5th swing, a short position can be added below the black line as shown in the figure.

Patterns are easy to trade. But finding the pattern from the chart and identifying it properly is the main art of trading.

Sometimes the only pattern is not enough to take the best trading decisions you may need multiple indicators to identify better entry and exit points.

You can also use technical scans to filter out stocks for trading the next day by using StockEdge App, now also available in the web version.

Did you find this pattern useful? Tell us by commenting below.

Happy Learning!

Tags: advancechart patternenglishmegaphone pattern
Share30TweetSend
Get Kotak Offer Get Kotak Offer Get Kotak Offer
Previous Post

All about the re-introduced Long Term Capital Gains Tax (LTCG tax) in India

Next Post

Home Makers to Financial Advisor – Changing Role of Women in India

Elearnmarkets

Elearnmarkets

Elearnmarkets (ELM) is a complete financial market portal where the market experts have taken the onus to spread financial education. ELM constantly experiments with new education methodologies and technologies to make financial education effective, affordable and accessible to all. You can connect with us on Twitter @elearnmarkets.

Related Posts

Understand Slippage in Trading
Technical Analysis

What is Slippage in Trading? Meaning & Examples

March 28, 2025
284
Breakout trading strategies
Technical Analysis

Top 5 Breakout Trading Strategies

March 12, 2025
1k
5 stocks for today
Technical Analysis

5 Stocks to Buy Today That Could Beat the NIFTY in 2025!

May 5, 2025
390
Image describing What is marginal trading facility
Technical Analysis

 What is a Margin Trading Facility? Advantages & Risks

April 4, 2025
657

Comments 15

  1. Ripples Advisory says:
    7 years ago

    Thanks for sharing with us, Keep up the good job…

    Reply
    • Tista Sengupta says:
      7 years ago

      Welcome

      Reply
  2. amit says:
    7 years ago

    awesome and easy language to use for explanation

    Reply
    • Tista Sengupta says:
      7 years ago

      Hello Amit,

      Thank you for your comment.

      You can also read a similar article: How to trade the Price Channel Continuation pattern
      Happy Reading!!

      Reply
  3. Dave Braskett says:
    6 years ago

    Really great information, thanks for the share and insights! I will recommend this to my friends for sure.

    Reply
    • Sakshi Agarwal says:
      6 years ago

      Hi,

      Thank you for Reading!

      Keep Reading

      Reply
  4. https://scalar.usc.edu/works/hotmaill-live/hotmail.html#hotmail-sign-up says:
    5 years ago

    Terrific woгk! Thаt is tһe type оf info that should be shared acroѕs the net.
    Shame on the search engines fօr not positioning tһiѕ post higher!
    Ϲome on ⲟver ɑnd talk оver ԝith my web site .
    Тhank you =)

    Reply
  5. www.inklusion-freiburg.net says:
    5 years ago

    Hey! I could have sworn I’ve been to this site before but after checking through some of the post I realized it’s new to
    me. Anyways, I’m definitely glad I found it and I’ll be book-marking and checking back often!

    Reply
  6. frolep rotrem says:
    5 years ago

    You got a very excellent website, Glad I detected it through yahoo.

    Reply
  7. Sal says:
    5 years ago

    Nice explanation and presentation on the site. Just enough to get the point across with actionable content.

    Reply
    • Sakshi Agarwal says:
      5 years ago

      Hi,

      We are glad that you liked our blog post.

      You can read more technical blogs from here.

      Thank you for Reading!

      Reply
  8. Joe Molumaela says:
    4 years ago

    Very nice and simple explanations even a Grade R pupil will quickly understand.

    Reply
    • Sakshi Agarwal says:
      4 years ago

      Hi,

      We really appreciated that you liked our blog.

      Keep Reading!

      Reply
  9. suchit verma says:
    3 years ago

    excellent explanation. thanks!

    Reply
    • Sakshi Agarwal says:
      3 years ago

      Hi,

      We really appreciated that you liked our blog! Thank you for your feedback!

      Keep Reading!

      Reply

Leave a Reply Cancel reply

Your email address will not be published. Required fields are marked *

Disclaimer

Elearnmarkets (Kredent InfoEdge Pvt. Ltd.) is a SEBI-registered Research Analyst (RA) entity (SEBI Registration No.: INH300007493). The information provided in this article is for educational and informational purposes only and should not be considered as an offer to buy or sell any securities or investment products.

The stocks, securities, and investment instruments mentioned herein are not recommendations under SEBI (Research Analysts) Regulations, 2014. Readers are advised to conduct their own due diligence and seek independent financial advice before making any investment decisions.

Investments in securities markets are subject to market risks. Please read all related documents carefully before investing. Investing in Equity Shares,
Derivatives, Mutual Funds, or other instruments carry inherent risks, including potential loss of capital. Elearnmarkets (Kredent InfoEdge Pvt. Ltd.) does not provide any guarantee or assurance of returns on any investments. Past performance is not indicative of future performance.

Elearnmarkets Logo

Follow Us

Facebook-f X-twitter Instagram Linkedin-in Youtube Telegram

Register on Elearnmarkets

Continue your financial learning by creating your own account on Elearnmarkets.com

Register Free Account

Download App

Playstore logo
Download on app store

Categories

  • Basic Finance
  • Derivatives
  • Financial Planning
  • Fundamental Analysis
  • Technical Analysis
  • Mutual Funds
  • Miscellaneous

Popular On Elearnmarkets

  • Market Superheroes:
  • Vivek Bajaj
  • Chetan Panchamia
  • Ashish Kyal
  • Premal Parekh
  • Abhijit Paul
  • Jegan
  • Sivakumar Jayachadran
  • Jyoti Budhia
  • Vivek Gadodia
  • Vishal Mehta
  • Piyush Chaudhry
  • Santosh Pasi
  • Gomathi Shankar
  • Market Superheroes:
  • Vivek Bajaj
  • Chetan Panchamia
  • Ashish Kyal
  • Premal Parekh
  • Abhijit Paul
  • Jegan
  • Sivakumar Jayachadran
  • Jyoti Budhia
  • Vivek Gadodia
  • Vishal Mehta
  • Piyush Chaudhry
  • Santosh Pasi
  • Gomathi Shankar
  • Courses:​
  • Options Trading
  • Dow Theory
  • Momentum Trading
  • Stock Investing
  • Harmonic Chart Patterns
  • Algo Trading
  • Elliot Wave Theory
  • Advanced Excel
  • Cryptocurrency
  • NSE Certification Course
  • Courses:​
  • Options Trading
  • Dow Theory
  • Momentum Trading
  • Stock Investing
  • Harmonic Chart Patterns
  • Algo Trading
  • Elliot Wave Theory
  • Advanced Excel
  • Cryptocurrency
  • NSE Certification Course
  • Webinars:
  • Bank Nifty Scalping
  • Intraday Trading Strategies
  • Options Trading Strategies
  • Options selling
  • Price Action
  • Relative Strength
  • Tax Planning
  • Options Buying
  • Growth Stocks
  • Portfolio Management
  • Risk Management
  • Renko Charts
  • Crude Oil
  • Traders Psychology
  • Moving Average
  • Multibagger Stocks
  • Free Learning Modules:
  • Intraday Trading
  • Options Scalping
  • Swing Trading
  • Financial Modelling
  • RSI Indicator
  • Bollinger Bands
  • Pricing of Futures
  • Personal Finance
  • Initial Public Offerings (IPO)
  • Value Investing
  • Technical Indicators
  • Candlesticks
  • Chart Patterns
  • Option Greeks
  • ELSS Funds
  • Banking and Insurance
  • Real Estate
  • Gold
  • Book Summaries:
  • Rich Dad Poor Dad
  • Psychology of Money
  • The Intelligent Investor
  • The Richest Man in Babylon
  • Think and Trade Like a Champion
  • Value Investing and Behavioural Finance
  • Trading in the Zone
  • Learn to Earn
  • Book Summaries:
  • Rich Dad Poor Dad
  • Psychology of Money
  • The Intelligent Investor
  • The Richest Man in Babylon
  • Think and Trade Like a Champion
  • Value Investing and Behavioural Finance
  • Trading in the Zone
  • Learn to Earn
  • Tools:
  • CAGR Calculator
  • SIP Calculator
  • eLearnOptions
  • Future Value Calculator
  • Present Value Calculator
  • Atal Pension Yojana
  • Cost of Delay Calculator
  • Become a Crorepati
  • Tools:
  • CAGR Calculator
  • SIP Calculator
  • eLearnOptions
  • Future Value Calculator
  • Present Value Calculator
  • Atal Pension Yojana
  • Cost of Delay Calculator
  • Become a Crorepati

© 2025 Elearnmarkets. All Rights Reserved

  • Visit Elearnmarkets
  • Courses
  • Webinars
  • Financial Guides
  • Get Free Counselling
  • Visit Elearnmarkets
  • Courses
  • Webinars
  • Financial Guides
  • Get Free Counselling

Download Our App

No Result
View All Result
  • Article Categories
    • Basic Finance
    • Derivatives
    • Financial Planning
    • Fundamental Analysis
    • Technical Analysis
    • ETFs & Mutual Funds
    • Marketshala
    • Miscellaneous
  • Language
    • Hindi
    • Bengali
    • English
  • Courses
  • Webinars
  • Stories
Get Free Course

© 2024 Elearnmarkets All Rights Reserved

A Handbook of Technical Analysis
To start your trading journey as a seasoned technical analyst
Download Guide For FREE
Guidebook On Chart Patterns
Take Your Trading To The Next Level With Strategies Shared In This Ebook
Download Guide For FREE
Trading Day 2025