Elearnmarkets - Financial Market Learning
  • Categories
    • Basic Finance
    • Derivatives
    • Financial Planning
    • Fundamental Analysis
    • Technical Analysis
    • Marketshala
    • Miscellaneous
  • Language
    • English
    • Hindi
    • Bengali
No Result
View All Result
  • Courses
  • Webinars
  • Learn On Elearnmarkets
Elearnmarkets - Learn Stock Market, trading, investing for Free
No Result
View All Result
Home Technical Analysis Market Analysis Charts
MARKSANS PHARMA shows-off a classic Distribution formation 1

MARKSANS PHARMA shows-off a classic Distribution formation

Elearnmarkets by Elearnmarkets
November 18, 2020
in Charts, Market Analysis
Reading Time: 2 mins read
0
125
VIEWS
Share on FacebookShare on TwitterShare on WhatsApp

MARKSANS PHARMA , DAILY

marksans pharma, daily
MARKSANS PHARMA, DAILY- Accumulation and Distribution zone

After the last week’s news of Marksans Pharma failing to pass the UK drug regulator’s inspection with respect to its Good Manufacturing Practices (GMP), its shares have plunged nearly 34%.

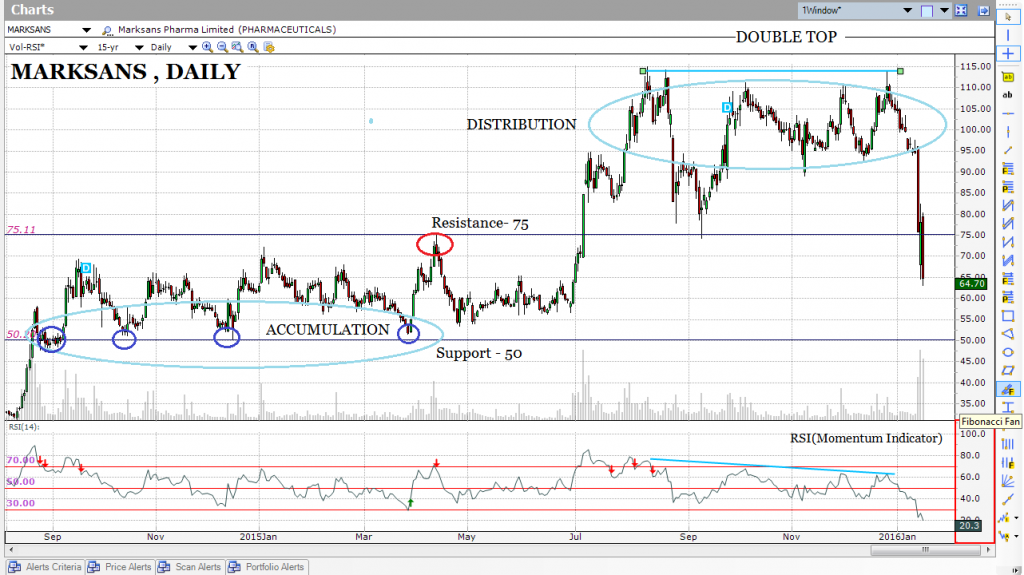
On studying the chart of Marksans Pharma, the following can be observed :

  • Clear indications of accumulation and distribution zones.
  • A Double Top formation and subsequent breakout.
  • RSI negative divergence.

Let’s look at the above in more details.

Accumulation Distribution zones :

From the period of January 2015 – July 2015, Marksans Pharma traded in a ‘Box/ Rectangle/Range’ of 50-75, this phase was the Accumulation phase, wherein institutional buying was driving the prices up to the resistance of 75.

Post the breakout beyond the level of 75, the prices shot up to 110-115, where began the distribution phase from mid-July up to the end of 2015.

Do you want to become a  technical analysis expert? Enroll in:  NSE Academy Certified Technical Analysis course on Elearnmarkets.

The Double Top formation:

At the high price zone of 110-115, Marksman Pharma tried to break above the 115 level twice but did not succeed.

This repeated attempt formed the Double top pattern which was confirmed when price broke below the level of 95 which was the low of the trough in between the two peaks.

In the double top formation breakout, the minimum target is the difference between the peaks and the trough, projected lower from the breakout level.

Here the minimum target points would be 115-95= 20 points and the target level would be 95-20=75.

The interesting thing here is that this projected target level of 75 is the same as the resistance level for the accumulation marked in the charts.

MARKSANS PHARMA

In the above chart, we can see that the target level of 75 has not only been achieved but also breached.

Since the negative momentum is very strong, the next level to look out for on the downside is the accumulation support level of 50.

RSI (Momentum Indicator) Negative Divergence:

A negative divergence is a phenomenon wherein the prices make higher high or like in our chart, an equal high, but the indicator fails to make the same and instead makes lower high.

This behavior is an indication of decreasing buying interest and tells the observer that the top is nearby.

On the chart of Marksans Pharma, when the Double Top was in formation the RSI had given an early indication of the upcoming weakness, warning anyone who was analyzing it at that time that the dark days were coming.

Another more recent point to take note of in the chart is the level at which RSI is currently.

It has passed below the level of 30, and this is an indication of Range Shift.

In bull trend, RSI trends in the zone of above 70, touching lows at 30, whereas in a bear trend, RSI stays shy of the 60 level on the upside and does not respect the level of 30  breaching it very easily.


Tags: englishmomentum indicatorrsi
ShareTweetSend
Previous Post

Law of demand – The Fallacy in Stock Market

Next Post

MARKET WRAP 18TH JAN 2016

Elearnmarkets

Elearnmarkets

Elearnmarkets (ELM) is a complete financial market portal where the market experts have taken the onus to spread financial education. ELM constantly experiments with new education methodologies and technologies to make financial education effective, affordable and accessible to all. You can connect with us on Twitter @elearnmarkets.

Related Posts

Hourly Chart
Market Analysis

Nifty Ends on Positive Note, Gains Approx. 475 Points on Positive Global Factors

November 18, 2020
378
Weekly Chart
Market Analysis

Huge Sell-Off Makes the Market Close in a Negative Note on the Expiry Week

November 18, 2020
175
Hourly Chart
Market Analysis

Nifty Ends in Green. Rupee Appreciates and Falling Crude Price Helped the Market to Recover Approx. 140 Point

November 18, 2020
129
Hourly Chart
Market Analysis

Sell Off Continues. Nifty Ends The Week With Three Consecutive Red Candles

November 18, 2020
141

Leave a Reply Cancel reply

Your email address will not be published. Required fields are marked *

Follow Us

Facebook-f Twitter Instagram Linkedin-in Youtube Telegram

Register on Elearnmarkets

Continue your financial learning by creating your own account on Elearnmarkets.com

Register Free Account

Download App

Categories

  • Basic Finance
  • Derivatives
  • Financial Planning
  • Fundamental Analysis
  • Technical Analysis
  • Marketshala
  • Miscellaneous

Popular On Elearnmarkets

  • Market Superheroes:
  • Vivek Bajaj
  • Chetan Panchamia
  • Ashish Kyal
  • Premal Parekh
  • Abhijit Paul
  • Jegan
  • Sivakumar Jayachadran
  • Vishal Malkan
  • Jyoti Budhia
  • Vivek Gadodia
  • Vishal Mehta
  • Piyush Chaudhry
  • Santosh Pasi
  • Gomathi Shankar
  • Market Superheroes:
  • Vivek Bajaj
  • Chetan Panchamia
  • Ashish Kyal
  • Premal Parekh
  • Abhijit Paul
  • Jegan
  • Sivakumar Jayachadran
  • Vishal Malkan
  • Jyoti Budhia
  • Vivek Gadodia
  • Vishal Mehta
  • Piyush Chaudhry
  • Santosh Pasi
  • Gomathi Shankar
  • Courses:​
  • Options Trading
  • Dow Theory
  • Momentum Trading
  • Stock Investing
  • Stock Market for Beginners
  • Harmonic Chart Patterns
  • Algo Trading
  • Elliot Wave Theory
  • Advanced Excel
  • Cryptocurrency
  • NSE Certification Course
  • Courses:​
  • Options Trading
  • Dow Theory
  • Momentum Trading
  • Stock Investing
  • Stock Market for Beginners
  • Harmonic Chart Patterns
  • Algo Trading
  • Elliot Wave Theory
  • Advanced Excel
  • Cryptocurrency
  • NSE Certification Course
  • Webinars:
  • Bank Nifty Scalping
  • Intraday Trading Strategies
  • Options Trading Strategies
  • Options selling
  • Price Action
  • Relative Strength
  • Tax Planning
  • Options Buying
  • Growth Stocks
  • Portfolio Management
  • Relative Strength Index
  • Risk Management
  • Renko Charts
  • Crude Oil
  • Traders Psychology
  • Moving Average
  • Multibagger Stocks
  • Free Learning Modules:
  • Intraday Trading
  • Options Scalping
  • Swing Trading
  • Financial Modelling
  • RSI Indicator
  • Bollinger Bands
  • Pricing of Futures
  • Personal Finance
  • Initial Public Offerings (IPO)
  • Value Investing
  • Technical Indicators
  • Candlesticks
  • Chart Patterns
  • Option Greeks
  • ELSS Funds
  • Banking and Insurance
  • Real Estate
  • Gold
  • Book Summaries:
  • Rich Dad Poor Dad
  • Psychology of Money
  • The Intelligent Investor
  • The Richest Man in Babylon
  • Think and Trade Like a Champion
  • Value Investing and Behavioural Finance
  • Trading in the Zone
  • Learn to Earn
  • Book Summaries:
  • Rich Dad Poor Dad
  • Psychology of Money
  • The Intelligent Investor
  • The Richest Man in Babylon
  • Think and Trade Like a Champion
  • Value Investing and Behavioural Finance
  • Trading in the Zone
  • Learn to Earn
  • Tools:
  • CAGR Calculator
  • SIP Calculator
  • eLearnOptions
  • Future Value Calculator
  • Present Value Calculator
  • Atal Pension Yojana
  • Cost of Delay Calculator
  • Become a Crorepati
  • Tools:
  • CAGR Calculator
  • SIP Calculator
  • eLearnOptions
  • Future Value Calculator
  • Present Value Calculator
  • Atal Pension Yojana
  • Cost of Delay Calculator
  • Become a Crorepati

© 2023 Elearnmarkets. All Rights Reserved

  • Visit Elearnmarkets
  • Courses
  • Webinars
  • Financial Guides
  • Get Free Counselling
  • Visit Elearnmarkets
  • Courses
  • Webinars
  • Financial Guides
  • Get Free Counselling

Get Elearnmarkets App

No Result
View All Result
  • Article Categories
    • Basic Finance
    • Derivatives
    • Financial Planning
    • Fundamental Analysis
    • Technical Analysis
    • Marketshala
    • Miscellaneous
  • Language
    • Hindi
    • Bengali
    • English
  • Courses
  • Webinars

© 2020 Elearnmarkets All Rights Reserved

Suggested Learning

Technical Analysis Made Easy

Certification in Online Technical Analysis

Online NSE Academy Certified Capital Market Professional (E-NCCMP)