Elearnmarkets - Financial Market Learning
  • Categories
    • Basic Finance
    • Derivatives
      • Futures
      • Options
    • Financial Planning
    • Fundamental Analysis
    • Technical Analysis
    • Marketshala
    • Miscellaneous
  • Language
    • English
    • Hindi
    • Bengali
No Result
View All Result
  • Courses
  • Webinars
  • Stories
Elearnmarkets - Learn Stock Market, trading, investing for Free
No Result
View All Result
Home Technical Analysis Market Analysis
MARKET WRAP 18TH JAN 2016 1

MARKET WRAP 18TH JAN 2016

Elearnmarkets by Elearnmarkets
January 19, 2023
in Market Analysis, Market Wrap
Reading Time: 2 mins read
0
36
VIEWS
Share on FacebookShare on XShare on WhatsApp

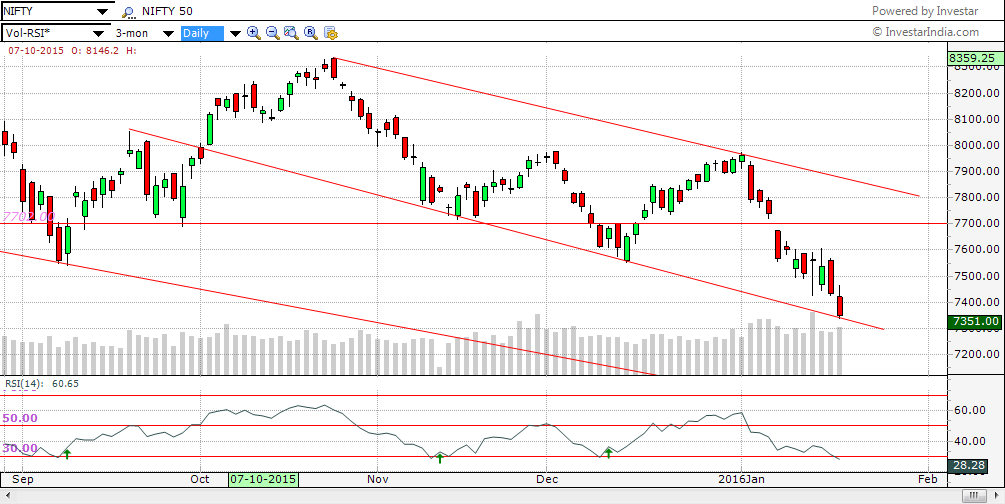
NIFTY saw another rough day today loosing 1.12% and closing 86 points lower from yesterday.


On the intraday 2 hour chart, we see the descending broadening triangle. It is a descending broadening triangle  because the resistance line is horizontal . Nifty has reached the 7350 support level which was mentioned in the previous market wrap.

Today we saw that the pressure was taken off from the bank stocks, however the infrastructure stocks caved and lost some 3-5%.

Karnataka bank was up by 4% on cues of it result announcement.

The international markets were stable today, Shanghai composite index closed 0.44% higher.  The Europeans indices are slightly lower as we speak.

CHART OF THE DAY

Due to the news of a penalty imposed on Adani Power’s company, Adani-Hazira Port Pvt Ltd (AHPPL) and its associate for forging environment clearance from the Ministry of Environment and Forests, it’s shared tanked 10.36% lower, closing at 26.40 after an opening of 29.40.

On the charts we see a broadening triangle which is often observed as a topping out pattern after a rally. This broadening triangle is different from the one observed previously in Nifty because both the upper and lower trendlines are diverging outward due to the wild swings in prices.

Notice the black rectangles on the chart. These are highlighting the volume observed, against the corresponding price movements.

RelatedPosts

Weekly Chart

Huge Sell-Off Makes the Market Close in a Negative Note on the Expiry Week

August 22, 2023
191
Hourly Chart

Nifty Ends in Green. Rupee Appreciates and Falling Crude Price Helped the Market to Recover Approx. 140 Point

August 31, 2023
133
Hourly Chart

Sell Off Continues. Nifty Ends The Week With Three Consecutive Red Candles

September 4, 2023
147

In rectangle #1, we see that the rally that started from 25, came about with very low volumes, this indicated that the rally does not have strength.

In rectangle #2 , we see that the volume was high in the consolidation phase, this indicates the shifting phase were in the ‘smart investors’ or professionals who have access to better information and resources, shift their holdings to the less smart investors. This was an early indication of the upcoming down move.


Tags: englishMarket Wrapniftystock market
ShareTweetSend
Get Kotak Offer Get Kotak Offer Get Kotak Offer
Previous Post

MARKSANS PHARMA shows-off a classic Distribution formation

Next Post

MARKET WRAP 19TH JAN 2016

Elearnmarkets

Elearnmarkets

Elearnmarkets (ELM) is a complete financial market portal where the market experts have taken the onus to spread financial education. ELM constantly experiments with new education methodologies and technologies to make financial education effective, affordable and accessible to all. You can connect with us on Twitter @elearnmarkets.

Related Posts

Weekly Chart
Market Analysis

Huge Sell-Off Makes the Market Close in a Negative Note on the Expiry Week

August 22, 2023
191
Hourly Chart
Market Analysis

Nifty Ends in Green. Rupee Appreciates and Falling Crude Price Helped the Market to Recover Approx. 140 Point

August 31, 2023
133
Hourly Chart
Market Analysis

Sell Off Continues. Nifty Ends The Week With Three Consecutive Red Candles

September 4, 2023
147
Nifty Hourly Chart
Market Analysis

Nifty Witnessed A Flash Crash But Managed To Close Above 11100 Level

August 17, 2023
349

Leave a Reply Cancel reply

Your email address will not be published. Required fields are marked *

Elearnmarkets Logo

Follow Us

Facebook-f Twitter Instagram Linkedin-in Youtube Telegram

Register on Elearnmarkets

Continue your financial learning by creating your own account on Elearnmarkets.com

Register Free Account

Download App

Playstore logo
Download on app store

Categories

  • Basic Finance
  • Derivatives
  • Financial Planning
  • Fundamental Analysis
  • Technical Analysis
  • Marketshala
  • Miscellaneous

Popular On Elearnmarkets

  • Market Superheroes:
  • Vivek Bajaj
  • Chetan Panchamia
  • Ashish Kyal
  • Premal Parekh
  • Abhijit Paul
  • Jegan
  • Sivakumar Jayachadran
  • Vishal Malkan
  • Jyoti Budhia
  • Vivek Gadodia
  • Vishal Mehta
  • Piyush Chaudhry
  • Santosh Pasi
  • Gomathi Shankar
  • Market Superheroes:
  • Vivek Bajaj
  • Chetan Panchamia
  • Ashish Kyal
  • Premal Parekh
  • Abhijit Paul
  • Jegan
  • Sivakumar Jayachadran
  • Vishal Malkan
  • Jyoti Budhia
  • Vivek Gadodia
  • Vishal Mehta
  • Piyush Chaudhry
  • Santosh Pasi
  • Gomathi Shankar
  • Courses:​
  • Options Trading
  • Dow Theory
  • Momentum Trading
  • Stock Investing
  • Stock Market for Beginners
  • Harmonic Chart Patterns
  • Algo Trading
  • Elliot Wave Theory
  • Advanced Excel
  • Cryptocurrency
  • NSE Certification Course
  • Courses:​
  • Options Trading
  • Dow Theory
  • Momentum Trading
  • Stock Investing
  • Stock Market for Beginners
  • Harmonic Chart Patterns
  • Algo Trading
  • Elliot Wave Theory
  • Advanced Excel
  • Cryptocurrency
  • NSE Certification Course
  • Webinars:
  • Bank Nifty Scalping
  • Intraday Trading Strategies
  • Options Trading Strategies
  • Options selling
  • Price Action
  • Relative Strength
  • Tax Planning
  • Options Buying
  • Growth Stocks
  • Portfolio Management
  • Relative Strength Index
  • Risk Management
  • Renko Charts
  • Crude Oil
  • Traders Psychology
  • Moving Average
  • Multibagger Stocks
  • Free Learning Modules:
  • Intraday Trading
  • Options Scalping
  • Swing Trading
  • Financial Modelling
  • RSI Indicator
  • Bollinger Bands
  • Pricing of Futures
  • Personal Finance
  • Initial Public Offerings (IPO)
  • Value Investing
  • Technical Indicators
  • Candlesticks
  • Chart Patterns
  • Option Greeks
  • ELSS Funds
  • Banking and Insurance
  • Real Estate
  • Gold
  • Book Summaries:
  • Rich Dad Poor Dad
  • Psychology of Money
  • The Intelligent Investor
  • The Richest Man in Babylon
  • Think and Trade Like a Champion
  • Value Investing and Behavioural Finance
  • Trading in the Zone
  • Learn to Earn
  • Book Summaries:
  • Rich Dad Poor Dad
  • Psychology of Money
  • The Intelligent Investor
  • The Richest Man in Babylon
  • Think and Trade Like a Champion
  • Value Investing and Behavioural Finance
  • Trading in the Zone
  • Learn to Earn
  • Tools:
  • CAGR Calculator
  • SIP Calculator
  • eLearnOptions
  • Future Value Calculator
  • Present Value Calculator
  • Atal Pension Yojana
  • Cost of Delay Calculator
  • Become a Crorepati
  • Tools:
  • CAGR Calculator
  • SIP Calculator
  • eLearnOptions
  • Future Value Calculator
  • Present Value Calculator
  • Atal Pension Yojana
  • Cost of Delay Calculator
  • Become a Crorepati

© 2023 Elearnmarkets. All Rights Reserved

  • Visit Elearnmarkets
  • Courses
  • Webinars
  • Financial Guides
  • Get Free Counselling
  • Visit Elearnmarkets
  • Courses
  • Webinars
  • Financial Guides
  • Get Free Counselling

Get Elearnmarkets App

No Result
View All Result
  • Article Categories
    • Basic Finance
    • Derivatives
    • Financial Planning
    • Fundamental Analysis
    • Technical Analysis
    • Marketshala
    • Miscellaneous
  • Language
    • Hindi
    • Bengali
    • English
  • Courses
  • Webinars
  • Stories

© 2020 Elearnmarkets All Rights Reserved