Elearnmarkets - Financial Market Learning
  • Categories
    • Basic Finance
    • Derivatives
    • Financial Planning
    • Fundamental Analysis
    • Technical Analysis
    • Marketshala
    • Miscellaneous
  • Language
    • English
    • Hindi
    • Bengali
No Result
View All Result
  • Courses
  • Webinars
  • Learn On Elearnmarkets
Elearnmarkets - Learn Stock Market, trading, investing for Free
No Result
View All Result
Home Technical Analysis Market Analysis Market Wrap

MARKET WRAP for 1st March, 16: Nifty, BankNifty rally post Budget !

Elearnmarkets by Elearnmarkets
November 18, 2020
in Market Wrap, Market Analysis
Reading Time: 2 mins read
1
50
VIEWS
Share on FacebookShare on TwitterShare on WhatsApp

With the sad month of February ending yesterday in which we saw nifty lose a good 7.7%  and 570 points on close to close basis, the market was in a cheerful mood today in appreciation of the Budget announced yesterday.

As we had discussed that the low of 12th feb’s hammer had been tested amidst volatility, today Nifty formed a very bullish pattern called the Marubozu. Now this pattern is a solid green body as evident and is a signifant bullish candle as it has no upper and lower wick.

If we look at the sectoral performance for the month of February, it was majorly a downer and almost all the sectors were bathed in red with realty being the worst hit, losing 14.82%, followed by the Nifty Midcap 50 down 12%, BankNifty down 11%, and Nifty down 7.78%.

If we look at today’s performance the Nifty indices all cheered and positivity was rampant in every sector and index especially the realty index whixh closed 5% higher.

On the same tone lets take in the winners of the day , where we have ITC leading with a rally of 10.50% closely followed by DLF which was up 10.34%. The volume traded on ITC was unnaturally high, nearly600% of its average daily volumes.

Here we have the chart showing how the stock reacted to the news which was highly expected and pre discounted in the stock’s price.

On DLF’s Chart we can see a good reversal as it has bounced up from the support trendline which goes back almost 7 years and the resistance is present somewhere in the zone of 200.

The losers of the days show no significant name today except for ONGC, which roughly a percent down.

The international indices are also in cheer with our Indian indices oputperforming the global markets , closely followed by Shanghai Composite and Hangseng.

CHART OF THE DAY

REC LTD
REC LTD

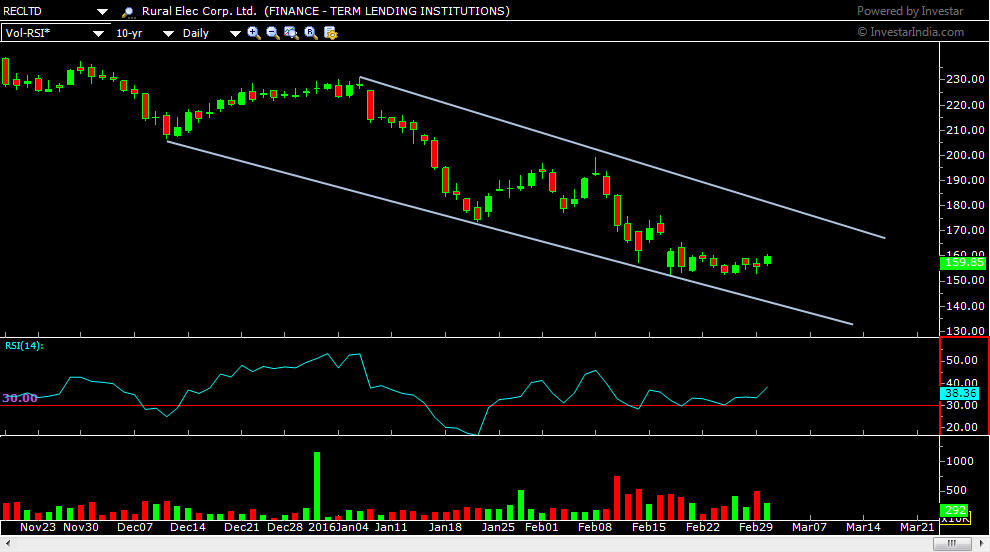
We have the daily chart of RECLTD that is rural electriv corporate ltd, and we see strong support coming in from both the trendline and the momentum indicator here. Also with the government’s allocation of 2.87 lakh crores for village development, we can hope for this stock to continue the positivity in days to come.


_____________________________________________________________________________________________________________________


Read more articles here:

http://blog.elearnmarkets.com/market/nifty-chart/

http://blog.elearnmarkets.com/market/nifty-live/

http://blog.elearnmarkets.com/market/nifty-live-chart/

Tags: Budgetenglishnifty
ShareTweetSend
Previous Post

How to Save and Invest for a New Baby!

Next Post

Larson and Toubro (LT) – Choppy Movement, Rigorous Support Hint Towards a strong upmove.

Elearnmarkets

Elearnmarkets

Elearnmarkets (ELM) is a complete financial market portal where the market experts have taken the onus to spread financial education. ELM constantly experiments with new education methodologies and technologies to make financial education effective, affordable and accessible to all. You can connect with us on Twitter @elearnmarkets.

Related Posts

Hourly Chart
Market Analysis

Nifty Ends on Positive Note, Gains Approx. 475 Points on Positive Global Factors

November 18, 2020
378
Weekly Chart
Market Analysis

Huge Sell-Off Makes the Market Close in a Negative Note on the Expiry Week

November 18, 2020
175
Hourly Chart
Market Analysis

Nifty Ends in Green. Rupee Appreciates and Falling Crude Price Helped the Market to Recover Approx. 140 Point

November 18, 2020
129
Hourly Chart
Market Analysis

Sell Off Continues. Nifty Ends The Week With Three Consecutive Red Candles

November 18, 2020
141

Comments 1

  1. Pradhumn says:
    7 years ago

    Great details about market movement….
    stockgurus.blogspot.com/

    Reply

Leave a Reply Cancel reply

Your email address will not be published. Required fields are marked *

Follow Us

Facebook-f Twitter Instagram Linkedin-in Youtube Telegram

Register on Elearnmarkets

Continue your financial learning by creating your own account on Elearnmarkets.com

Register Free Account

Download App

Categories

  • Basic Finance
  • Derivatives
  • Financial Planning
  • Fundamental Analysis
  • Technical Analysis
  • Marketshala
  • Miscellaneous

Popular On Elearnmarkets

  • Market Superheroes:
  • Vivek Bajaj
  • Chetan Panchamia
  • Ashish Kyal
  • Premal Parekh
  • Abhijit Paul
  • Jegan
  • Sivakumar Jayachadran
  • Vishal Malkan
  • Jyoti Budhia
  • Vivek Gadodia
  • Vishal Mehta
  • Piyush Chaudhry
  • Santosh Pasi
  • Gomathi Shankar
  • Market Superheroes:
  • Vivek Bajaj
  • Chetan Panchamia
  • Ashish Kyal
  • Premal Parekh
  • Abhijit Paul
  • Jegan
  • Sivakumar Jayachadran
  • Vishal Malkan
  • Jyoti Budhia
  • Vivek Gadodia
  • Vishal Mehta
  • Piyush Chaudhry
  • Santosh Pasi
  • Gomathi Shankar
  • Courses:​
  • Options Trading
  • Dow Theory
  • Momentum Trading
  • Stock Investing
  • Stock Market for Beginners
  • Harmonic Chart Patterns
  • Algo Trading
  • Elliot Wave Theory
  • Advanced Excel
  • Cryptocurrency
  • NSE Certification Course
  • Courses:​
  • Options Trading
  • Dow Theory
  • Momentum Trading
  • Stock Investing
  • Stock Market for Beginners
  • Harmonic Chart Patterns
  • Algo Trading
  • Elliot Wave Theory
  • Advanced Excel
  • Cryptocurrency
  • NSE Certification Course
  • Webinars:
  • Bank Nifty Scalping
  • Intraday Trading Strategies
  • Options Trading Strategies
  • Options selling
  • Price Action
  • Relative Strength
  • Tax Planning
  • Options Buying
  • Growth Stocks
  • Portfolio Management
  • Relative Strength Index
  • Risk Management
  • Renko Charts
  • Crude Oil
  • Traders Psychology
  • Moving Average
  • Multibagger Stocks
  • Free Learning Modules:
  • Intraday Trading
  • Options Scalping
  • Swing Trading
  • Financial Modelling
  • RSI Indicator
  • Bollinger Bands
  • Pricing of Futures
  • Personal Finance
  • Initial Public Offerings (IPO)
  • Value Investing
  • Technical Indicators
  • Candlesticks
  • Chart Patterns
  • Option Greeks
  • ELSS Funds
  • Banking and Insurance
  • Real Estate
  • Gold
  • Book Summaries:
  • Rich Dad Poor Dad
  • Psychology of Money
  • The Intelligent Investor
  • The Richest Man in Babylon
  • Think and Trade Like a Champion
  • Value Investing and Behavioural Finance
  • Trading in the Zone
  • Learn to Earn
  • Book Summaries:
  • Rich Dad Poor Dad
  • Psychology of Money
  • The Intelligent Investor
  • The Richest Man in Babylon
  • Think and Trade Like a Champion
  • Value Investing and Behavioural Finance
  • Trading in the Zone
  • Learn to Earn
  • Tools:
  • CAGR Calculator
  • SIP Calculator
  • eLearnOptions
  • Future Value Calculator
  • Present Value Calculator
  • Atal Pension Yojana
  • Cost of Delay Calculator
  • Become a Crorepati
  • Tools:
  • CAGR Calculator
  • SIP Calculator
  • eLearnOptions
  • Future Value Calculator
  • Present Value Calculator
  • Atal Pension Yojana
  • Cost of Delay Calculator
  • Become a Crorepati

© 2023 Elearnmarkets. All Rights Reserved

  • Visit Elearnmarkets
  • Courses
  • Webinars
  • Financial Guides
  • Get Free Counselling
  • Visit Elearnmarkets
  • Courses
  • Webinars
  • Financial Guides
  • Get Free Counselling

Get Elearnmarkets App

No Result
View All Result
  • Article Categories
    • Basic Finance
    • Derivatives
    • Financial Planning
    • Fundamental Analysis
    • Technical Analysis
    • Marketshala
    • Miscellaneous
  • Language
    • Hindi
    • Bengali
    • English
  • Courses
  • Webinars

© 2020 Elearnmarkets All Rights Reserved

Suggested Learning

Technical Analysis Made Easy

Certification in Online Technical Analysis

Online NSE Academy Certified Capital Market Professional (E-NCCMP)