Elearnmarkets - Financial Market Learning
  • Categories
    • Basic Finance
    • Derivatives
      • Futures
      • Options
    • Financial Planning
    • Fundamental Analysis
    • Technical Analysis
    • Marketshala
    • Miscellaneous
  • Language
    • English
    • Hindi
    • Bengali
No Result
View All Result
  • Courses
  • Webinars
  • Stories
Elearnmarkets - Learn Stock Market, trading, investing for Free
No Result
View All Result
Home Technical Analysis Market Analysis Charts

Larson and Toubro (LT) – Choppy Movement, Rigorous Support Hint Towards a strong upmove.

Elearnmarkets by Elearnmarkets
August 22, 2023
in Charts, Market Analysis
Reading Time: 3 mins read
0
233
VIEWS
Share on FacebookShare on XShare on WhatsApp

Larson and Toubro ( LT ) lost nearly 45% from the top of 1880 formed back in July 2015. Currently it is consolidating near an important level of 1100. Since mid-January 2016 , it has been taking support at the level of roughly 1100.

As we can see on the monthly chart of LT below, since 2007, the resistance and support trendlines have been playing very important roles in deciding the support and resistance zones for the stock.

LARSON AND TOUBRO
(Chart #1) LARSON AND TOUBRO, monthly chart
Support and Resistance levels
support-and-resistance

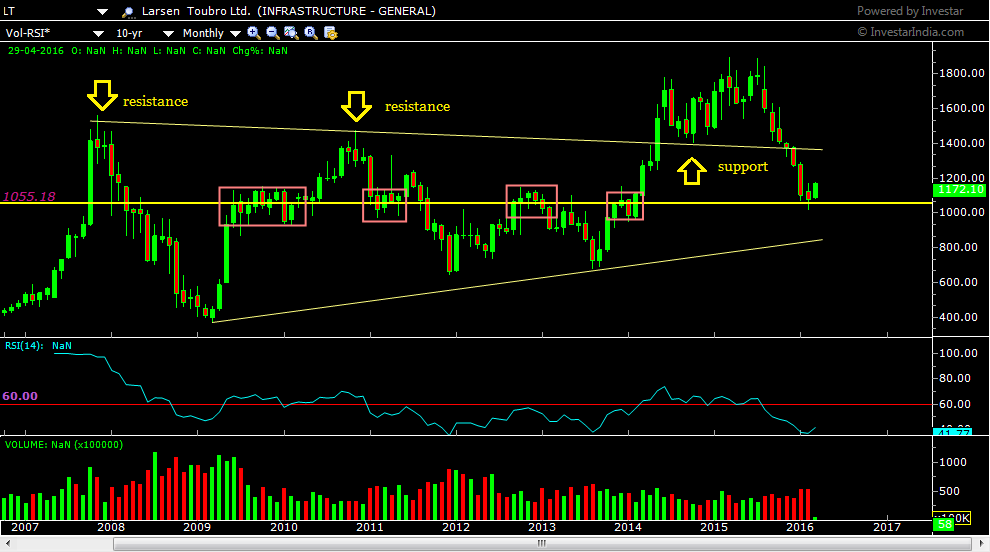
An instance of Change of polarity is also visible on the chart. In 2008 and 2011 we see the resistance trendline acting as the resistance however in 2014, after a breakout on the upside, the trendline acted as the support.  However the trendline has been breached in the recent correction witnessed.

The boxes drawn on the chart also highlight price activity in the zone of 950-1150 in the past. This proves that the zone is important in terms of supply and demand for LT. The fact that the price of LT has come to this level and shown a reversal upside is a plus for the stock.

In the daily chart of LT, lets take a closer look at the recent price movement.

LARSON AND TOUBRO
(Chart # 2)LARSON AND TOUBRO, daily chart

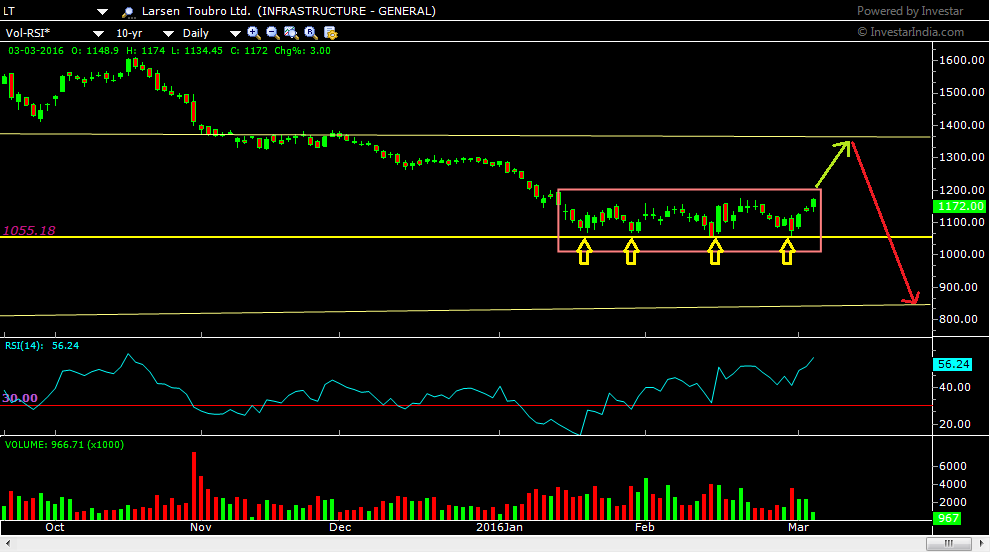
On taking a closer look, the level of 1055 comes out as the integral support level, from where the stock has bounced up four times. The box shows a consolidation phase and an upside breakout will ensure continued upside movement. However, the resistance is not very far, the trendline which we discussed above, also visible on the chart, poses resistance in the price zone of 1360-1390. RSI in lower window, drawn in blue line has also shown a positive divergence.

However, as shown in Chart #2, The upside appears to be restricted to the level of 1360 due to the presence of a resistance trendline. In case the prices turn lower again from the resistance level,  then the support level at 850 will become a possible level for the stock. However that is a distant thought and more like a Plan B that the main agenda of this post.

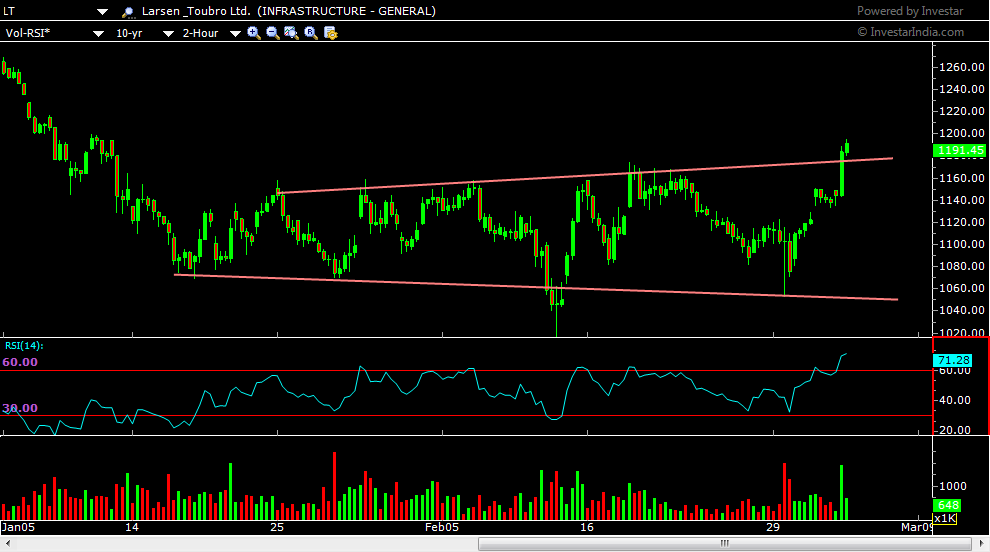
Another interesting phenomenon has occurred as I prepare this article. Below we have the 2 hours intraday chart of LT, showing that the consolidation , is more of a broadening triangle , and has given a breakout on good volumes, thereby reinstating the upside in this stock.

RelatedPosts

Weekly Chart

Huge Sell-Off Makes the Market Close in a Negative Note on the Expiry Week

August 22, 2023
191
Hourly Chart

Nifty Ends in Green. Rupee Appreciates and Falling Crude Price Helped the Market to Recover Approx. 140 Point

August 31, 2023
133
Hourly Chart

Sell Off Continues. Nifty Ends The Week With Three Consecutive Red Candles

September 4, 2023
147
LARSON AND TOUBRO
(Chart # 3) LARSON AND TOUBRO, 2 hour chart

Also, if you take into consideration the general market sentiments, you will know that the market in general has been extremely positive since the budget, whereas LT has not shown the same sentiment to that extent in-spite of being a high beta stock. This coupled with the consolidation and the low volumes on the recent declines(visible on the chart above)  adds to our hopes for this stock to perform better in coming days.

We welcome your feedback and comments on this article. If you have doubts related to the technical jargons mentioned in the article, you are encouraged to refer to the articles linked. You can also check NSE Academy Certified Essential Technical Analysis.

Tags: englishrsiSupport and resistance
ShareTweetSend
Get Kotak Offer Get Kotak Offer Get Kotak Offer
Previous Post

MARKET WRAP for 1st March, 16: Nifty, BankNifty rally post Budget !

Next Post

Sukanya Samriddhi Yojana: A Program Which is a Boon to Your Girl Child

Elearnmarkets

Elearnmarkets

Elearnmarkets (ELM) is a complete financial market portal where the market experts have taken the onus to spread financial education. ELM constantly experiments with new education methodologies and technologies to make financial education effective, affordable and accessible to all. You can connect with us on Twitter @elearnmarkets.

Related Posts

Weekly Chart
Market Analysis

Huge Sell-Off Makes the Market Close in a Negative Note on the Expiry Week

August 22, 2023
191
Hourly Chart
Market Analysis

Nifty Ends in Green. Rupee Appreciates and Falling Crude Price Helped the Market to Recover Approx. 140 Point

August 31, 2023
133
Hourly Chart
Market Analysis

Sell Off Continues. Nifty Ends The Week With Three Consecutive Red Candles

September 4, 2023
147
Nifty Hourly Chart
Market Analysis

Nifty Witnessed A Flash Crash But Managed To Close Above 11100 Level

August 17, 2023
349

Leave a Reply Cancel reply

Your email address will not be published. Required fields are marked *

Elearnmarkets Logo

Follow Us

Facebook-f Twitter Instagram Linkedin-in Youtube Telegram

Register on Elearnmarkets

Continue your financial learning by creating your own account on Elearnmarkets.com

Register Free Account

Download App

Playstore logo
Download on app store

Categories

  • Basic Finance
  • Derivatives
  • Financial Planning
  • Fundamental Analysis
  • Technical Analysis
  • Marketshala
  • Miscellaneous

Popular On Elearnmarkets

  • Market Superheroes:
  • Vivek Bajaj
  • Chetan Panchamia
  • Ashish Kyal
  • Premal Parekh
  • Abhijit Paul
  • Jegan
  • Sivakumar Jayachadran
  • Vishal Malkan
  • Jyoti Budhia
  • Vivek Gadodia
  • Vishal Mehta
  • Piyush Chaudhry
  • Santosh Pasi
  • Gomathi Shankar
  • Market Superheroes:
  • Vivek Bajaj
  • Chetan Panchamia
  • Ashish Kyal
  • Premal Parekh
  • Abhijit Paul
  • Jegan
  • Sivakumar Jayachadran
  • Vishal Malkan
  • Jyoti Budhia
  • Vivek Gadodia
  • Vishal Mehta
  • Piyush Chaudhry
  • Santosh Pasi
  • Gomathi Shankar
  • Courses:​
  • Options Trading
  • Dow Theory
  • Momentum Trading
  • Stock Investing
  • Stock Market for Beginners
  • Harmonic Chart Patterns
  • Algo Trading
  • Elliot Wave Theory
  • Advanced Excel
  • Cryptocurrency
  • NSE Certification Course
  • Courses:​
  • Options Trading
  • Dow Theory
  • Momentum Trading
  • Stock Investing
  • Stock Market for Beginners
  • Harmonic Chart Patterns
  • Algo Trading
  • Elliot Wave Theory
  • Advanced Excel
  • Cryptocurrency
  • NSE Certification Course
  • Webinars:
  • Bank Nifty Scalping
  • Intraday Trading Strategies
  • Options Trading Strategies
  • Options selling
  • Price Action
  • Relative Strength
  • Tax Planning
  • Options Buying
  • Growth Stocks
  • Portfolio Management
  • Relative Strength Index
  • Risk Management
  • Renko Charts
  • Crude Oil
  • Traders Psychology
  • Moving Average
  • Multibagger Stocks
  • Free Learning Modules:
  • Intraday Trading
  • Options Scalping
  • Swing Trading
  • Financial Modelling
  • RSI Indicator
  • Bollinger Bands
  • Pricing of Futures
  • Personal Finance
  • Initial Public Offerings (IPO)
  • Value Investing
  • Technical Indicators
  • Candlesticks
  • Chart Patterns
  • Option Greeks
  • ELSS Funds
  • Banking and Insurance
  • Real Estate
  • Gold
  • Book Summaries:
  • Rich Dad Poor Dad
  • Psychology of Money
  • The Intelligent Investor
  • The Richest Man in Babylon
  • Think and Trade Like a Champion
  • Value Investing and Behavioural Finance
  • Trading in the Zone
  • Learn to Earn
  • Book Summaries:
  • Rich Dad Poor Dad
  • Psychology of Money
  • The Intelligent Investor
  • The Richest Man in Babylon
  • Think and Trade Like a Champion
  • Value Investing and Behavioural Finance
  • Trading in the Zone
  • Learn to Earn
  • Tools:
  • CAGR Calculator
  • SIP Calculator
  • eLearnOptions
  • Future Value Calculator
  • Present Value Calculator
  • Atal Pension Yojana
  • Cost of Delay Calculator
  • Become a Crorepati
  • Tools:
  • CAGR Calculator
  • SIP Calculator
  • eLearnOptions
  • Future Value Calculator
  • Present Value Calculator
  • Atal Pension Yojana
  • Cost of Delay Calculator
  • Become a Crorepati

© 2023 Elearnmarkets. All Rights Reserved

  • Visit Elearnmarkets
  • Courses
  • Webinars
  • Financial Guides
  • Get Free Counselling
  • Visit Elearnmarkets
  • Courses
  • Webinars
  • Financial Guides
  • Get Free Counselling

Get Elearnmarkets App

No Result
View All Result
  • Article Categories
    • Basic Finance
    • Derivatives
    • Financial Planning
    • Fundamental Analysis
    • Technical Analysis
    • Marketshala
    • Miscellaneous
  • Language
    • Hindi
    • Bengali
    • English
  • Courses
  • Webinars
  • Stories

© 2020 Elearnmarkets All Rights Reserved

Guidebook On Chart Patterns
Take Your Trading To The Next Level With Strategies Shared In This Ebook
Download Now