The week has started with a very good note . Nifty has eneded the first day with a gain of nearly 109 points after shattered the resistance of 7600 and 7650 in its wake. During the day, Nifty has taken a only a temporary consolidative stance near the level of 7600 and zoomed up to its closing at the level of 7664.
On the chart of Bank Nifty, we can see a whip like movement around the resistance trendline. Today the index closed just above the trendline and this move is expected upto the next resistance at the level of 16200.
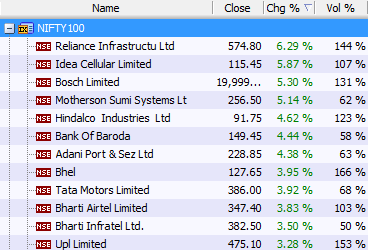
Among the other Nifty indices we see that the Nifty infra and Nifty IT indices have done exceptionally well closely followed by the Nifty Realty index.
The winners of the day are:
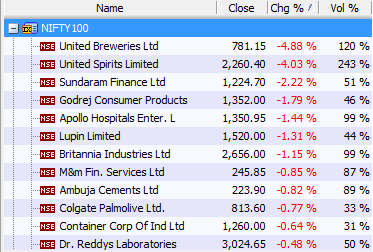
The losers of the day are:
The international picture:
Crude oil is trading relatively flat as we speak, this is contrary to Friday when the Crude was trading 3.50% higher. That I believe is the true reason behind today’s bullishness in the indian as well as other international indices as we will discuss in a jiffy. The gold and silver commodities are trading quite bullish with gains of .70% and 1.24% currently. Now we know that equity indices and inversely related to the precious metals. Following the same logic, we expect today’s euphoria to considerably subside tomorrow.
The US indices DJIA and NASDAQ had given flat closes on Friday, in today’s trade the prospects of bullishness don’t seem possible given a weak crude.
The European indices has shown strength at opening, gaining sharply , however as the day progresses the momentum can be seen subsiding and the FTSE, CAC40 and DAX have begun to eith droop or maintain the level.
The Asian indices have closed on good notes. Nikkie being the exception as always. The Shanghai, Sensex and Hangseng have all closed more than a percent higher, with sensex crossing above the 25000 level again( but not for long in my opinion)
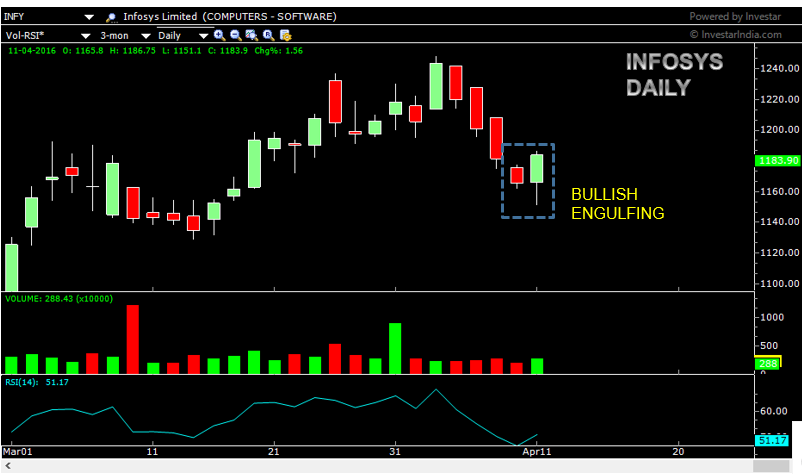
CHART OF THE DAY
We saw that Nifty IT index has done a good performance today. On this IT major’s chart, we can evidence that the goodness might as well continue. On the chart of Infosys a Japanese candlestick pattern called the Bullish engulfing pattern has emerged. This stock has been n correction for most of last week but things are about to change as Infy seems all ready to continue the bullish trend and head higher for the previous top of 1240 again.
________________________________________________________________________________________________________________________________________
Read more articles here:
https://blog.elearnmarkets.com/market/nifty-chart/


good analysis