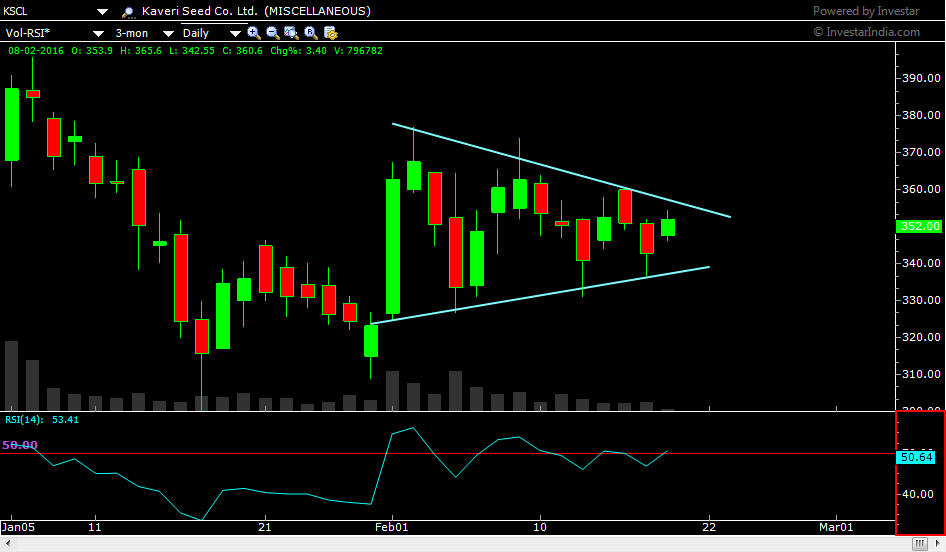
A symmetrical triangle is a technical chart pattern which is formed in bounds of two converging lines.
It shoots high or low, depending on the direction of the breakout.
If we look at the chart of Kaveri Seed Company Limites (KSCL) we will see that a symmetrical triangle is currently under formation on its charts and is probably very close to a breakout.

Know More: Symmetrical Triangle / Coil pattern / Isosceles Triangle
In the recent slide witnessed all over the stock market, we saw most stocks decline.
Kaveri seed was no exception.
It is currently fluctuating very close to its 52 weeks low.
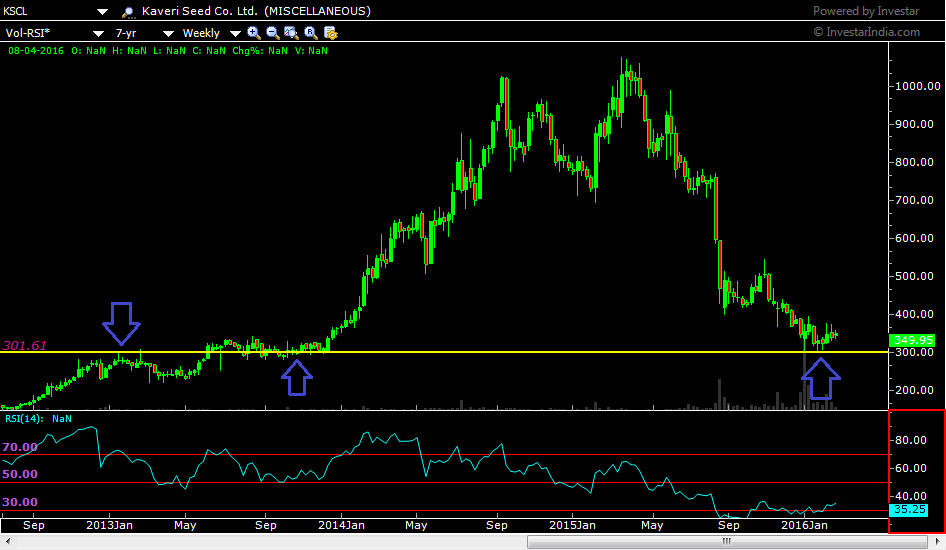
In the weekly chart of KSCL below, the level of 300 is drawn with a yellow line and we can see that this level has met with heavy activity in the past.
The arrows point of the instance when this level had acted as resistance first and then soon after as support.
Enroll in: NSE Academy Certified Technical Analysis course on Elearnmarkets to become a technical analysis expert.

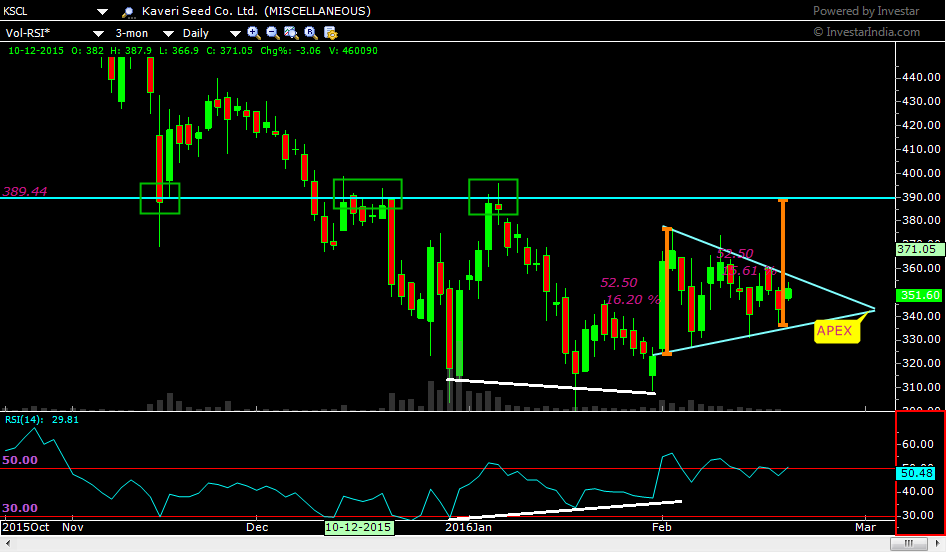
Coming back to the symmetrical triangle drawn on the below chart #3, we will see that the base, the broadest part of the triangle, is a good 52 points wide, and if project that from the recent point of support in the pattern, we get the level of 390 at the target level on the upside.
You may ask, we are we assuming an upside breakout as there is no written rule for it.
The answer is, that the other pieces of evidence are giving a bullish indication.
On the chart of KSCL, let us observe the momentum indicator (RSI), which has given a very good positive divergence highlighted with white lines on Chart #3.
Read More: RSI Indicator and How is it useful in Trading Stocks?
Also, the volumes have been consistently low as shown by the gray histogram lines on the chart right below the triangle.
Hence, in preparation for a breakout, we have prepared our action plan.

Also, on the chart, we see that 390 makes absolute sense as this level has been giving support to the price, in the range of consolidation, and the resistance point in the past.
Bottomline
Whether the prices move beyond the level of 390 is a question for later, but for now, we will await a breakout (hopefully with high volumes) and a rise upto 390.
Since depending on just one aspect is not enough when it comes to Technical Analysis, we have worked on the joint analysis of three indicators, RSI, Volumes, and chart patterns.


