Elearnmarkets - Financial Market Learning
  • Categories
    • Basic Finance
    • Derivatives
    • Financial Planning
    • Fundamental Analysis
    • Technical Analysis
    • Marketshala
    • Miscellaneous
  • Language
    • English
    • Hindi
    • Bengali
No Result
View All Result
  • Courses
  • Webinars
  • Learn On Elearnmarkets
Elearnmarkets - Learn Stock Market, trading, investing for Free
No Result
View All Result
Home Technical Analysis
Understanding Mat-Hold Candlestick Pattern 1

Understanding Mat-Hold Candlestick Pattern

Elearnmarkets by Elearnmarkets
July 18, 2022
in Technical Analysis
Reading Time: 4 mins read
0
10k
VIEWS
Share on FacebookShare on TwitterShare on WhatsApp

The Mat-Hold candlestick pattern is a five-candlestick pattern that appears during a trend and indicates that the market is likely to continue moving in the same direction. The pattern can be bullish or bearish, and it can be found in all assets and time frames. When applied appropriately, it has a high success rate.

In today’s blog, let us discuss in detail the mat-hold candlestick pattern-

Table Of Contents
  1. What is Mat-Hold Candlestick Pattern?
  2. Formation
  3. What do traders interpret?
  4. Trading Example
  5. Limitations of Mat-Hold Candlestick Pattern
  6. Bottomline

What is Mat-Hold Candlestick Pattern?

A candlestick formation known as a mat hold pattern shows the continuation of a previous move.

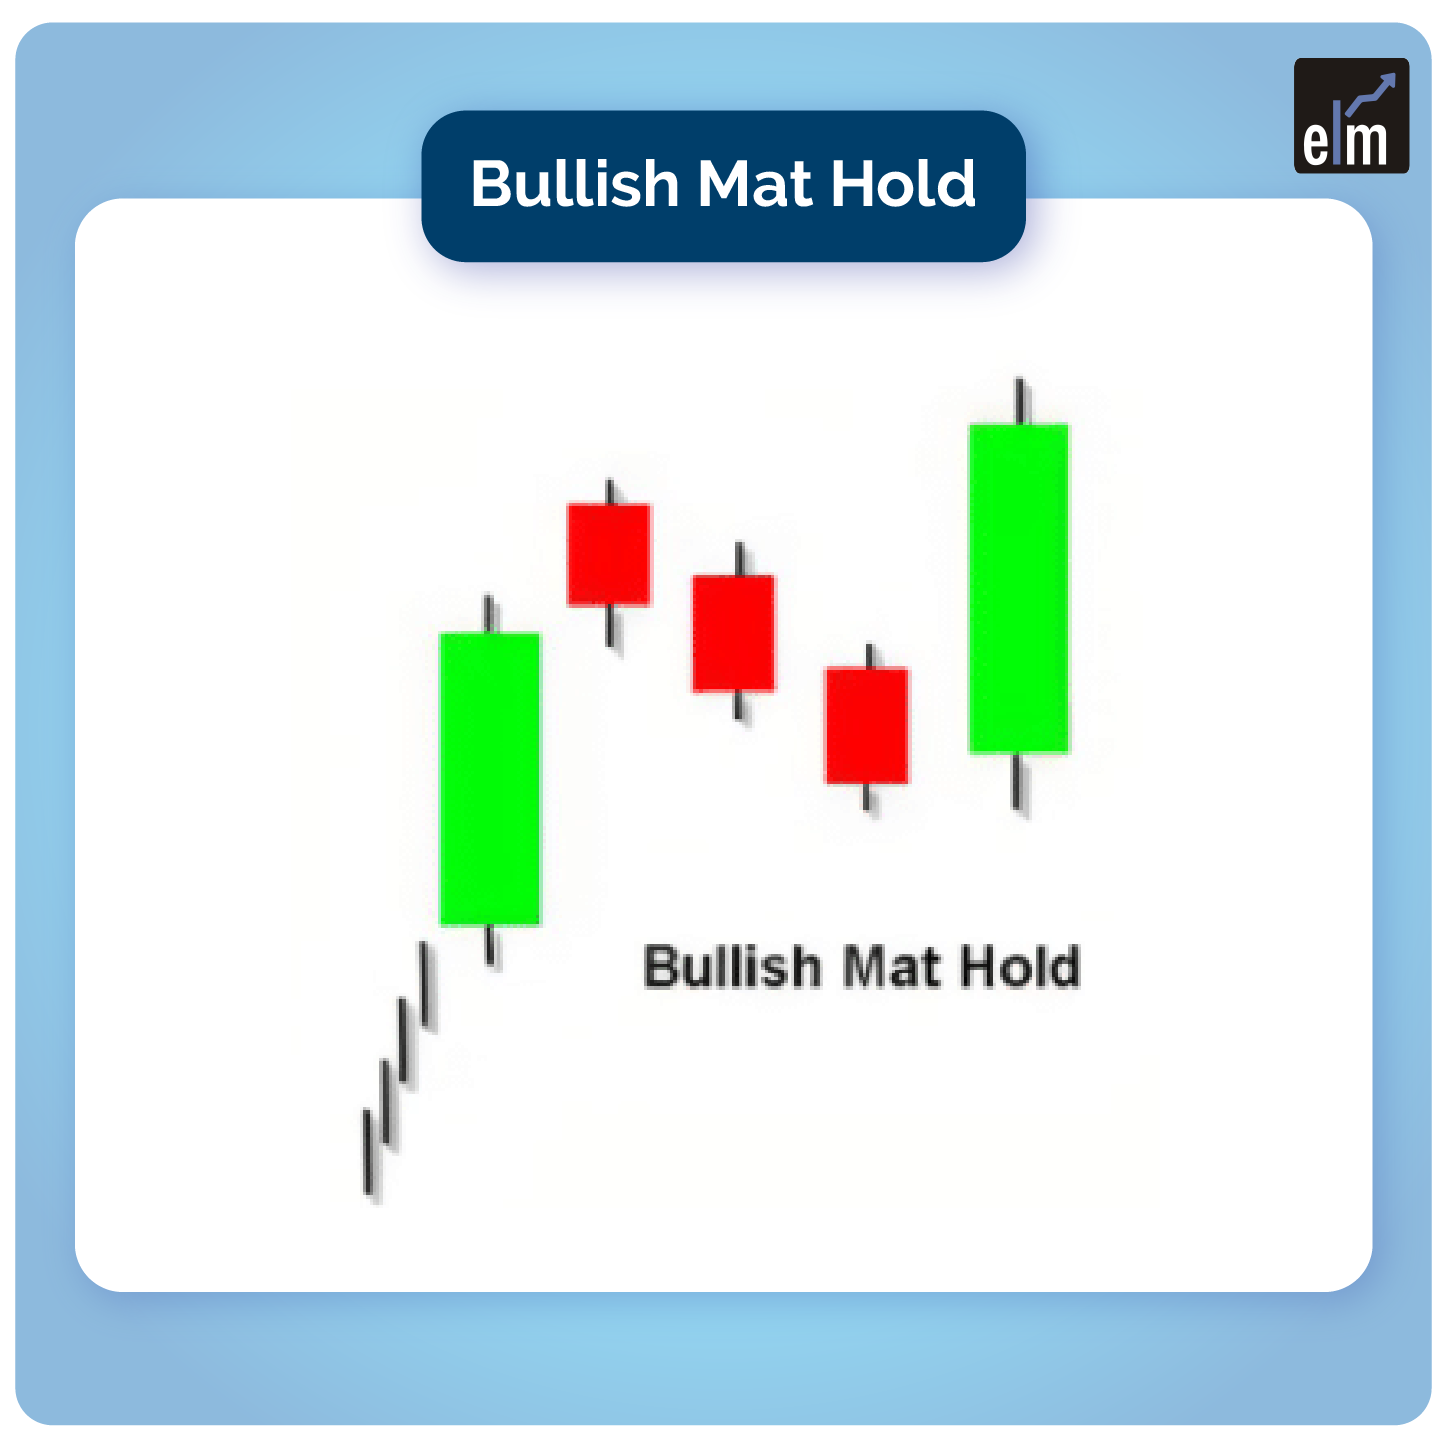
Mat hold patterns can be bullish or bearish. A bullish pattern consists of a large upward candle, a gap higher, and three smaller candles that move downward. These candles must stay above the first candle’s low point. The fifth candle is a huge candle that is moving upwards once more. The pattern appears as part of a larger upward trend.

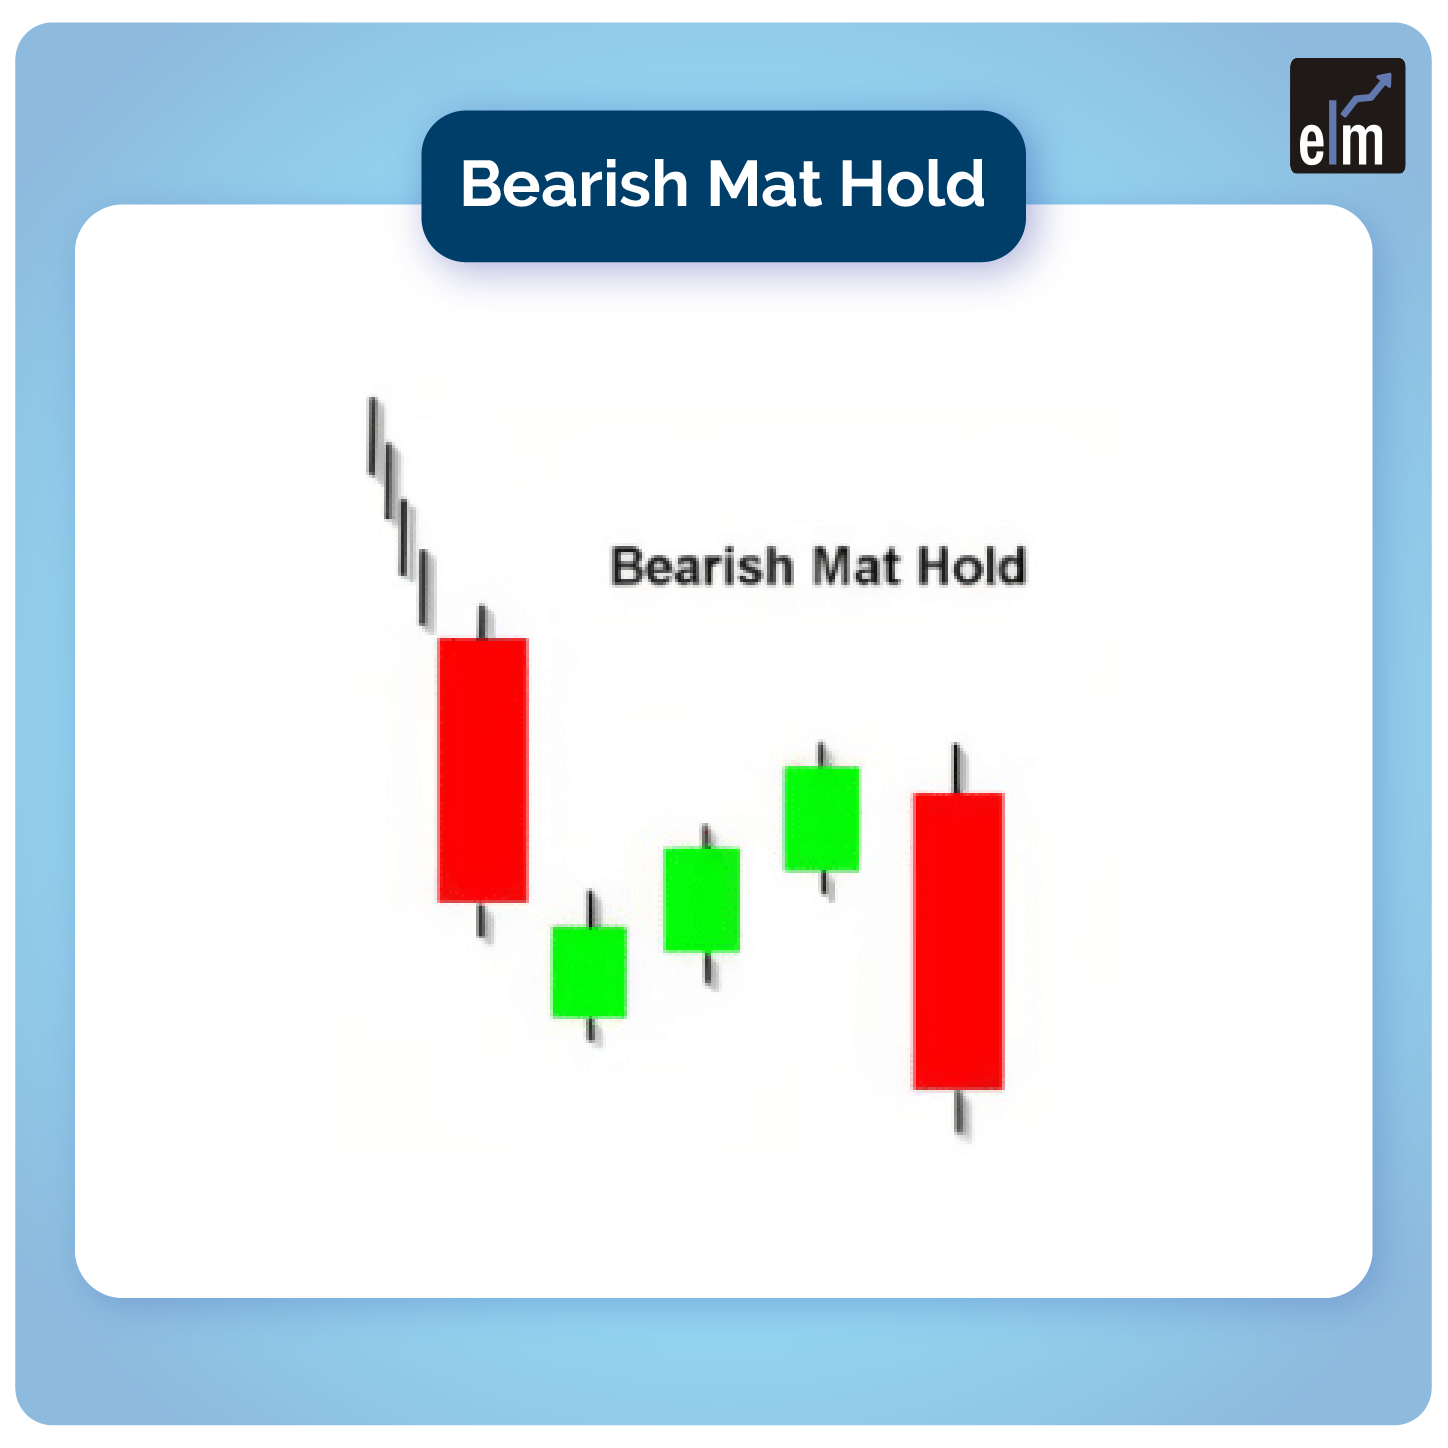
Candles one and five are large down candles in the bearish version, while candles two through four are smaller and travel to the upside. These candles must stay below the first candle’s peak point. A long candle to the downside, candle five, completes the pattern. It has to happen during a decline.

Formation

You must be aware of three key aspects to recognise the Mat Hold candlestick pattern:

Join TMP Join TMP Join TMP
mat-hold candlestick pattern
  • During a bullish or bearish trend, the Mat Hold pattern appears.
  • Five candlesticks make up the pattern: a bullish or bearish candle, three opposite candles, and another candle in the same direction as the first.
  • In either the bullish or bearish variation, the last candle must close above (or below) the previous fourth candle.
Understanding Mat-Hold Candlestick Pattern 2

What do traders interpret?

When a bullish mat hold pattern appears in an uptrend, it indicates that the trend is likely to resume to the upside. Traders can buy near the fifth candle’s closure (big up candle) or begin a long trade on the next candle. A stop loss is usually placed below the fifth candle’s low.

When a bearish mat hold pattern appears within a downtrend, the downtrend is likely to resume and prices will fall further. Traders may sell or short near the fifth candle’s close or on the next candle. Short positions have a stop loss above the fifth candle’s high.

Both variations of the pattern are quite uncommon. They illustrate that the price is firmly moving in the trending direction (candle one), with only slight pressure in the opposite direction (candles two through four) before it resumes its trending movement (candle five).

Trading Example

You’re seeking to join an existing trend when you trade the Mat Hold pattern. As a result, you’re waiting for the market to retrace in order to jump on board without incurring too many risks.

As previously stated, the Mat Hold chart pattern can emerge in bullish and bearish trends. Because it’s a continuation chart pattern, you’ll want to pair it with Fibonacci retracement levels to understand support and resistance levels better.

To know about other candlesticks, read our blog on All 35 Candlestick Chart Patterns in the Stock Market-Explained

Limitations of Mat-Hold Candlestick Pattern

The mat hold pattern is difficult to come by. However, it happens occasionally, and the price does not always move in the expected direction when the pattern is followed.

For the mat hold pattern, there is no profit target. The pattern does not show how far the price could go if it moves as planned. Another method, such as trend analysis or technical indicators, or possibly another candlestick pattern, will be required to determine an exit.

The mat hold pattern is best used in conjunction with other types of analysis because it can be unreliable if traded alone.

Learn from Market Experts

Trade Better with Candlesticks

Identify Trend Reversals with Candlesticks

Bottomline

We hope you found this blog informative and use it to its maximum potential in the practical world. Also, show some love by sharing this blog with your family and friends and helping us in our mission of spreading financial literacy.

Happy Investing!

Tags: basiccandlestick patternenglishMat-Hold Candlestick Patterntechnical analysis
ShareTweetSend
Previous Post

Understanding On-Neck Candlestick Pattern

Next Post

How to trade with High-Wave Candlestick Pattern?

Elearnmarkets

Elearnmarkets

Elearnmarkets (ELM) is a complete financial market portal where the market experts have taken the onus to spread financial education. ELM constantly experiments with new education methodologies and technologies to make financial education effective, affordable and accessible to all. You can connect with us on Twitter @elearnmarkets.

Related Posts

Technical Analysis in Stock Trading 3
Technical Analysis

Technical Analysis in Stock Trading

May 31, 2023
6k
The Ultimate guide to Trading Divergences 4
Technical Analysis

The Ultimate guide to Trading Divergences

May 26, 2023
993
Trading Psychology: Guide to Master Your Mind in 5 Steps 5
Technical Analysis

Trading Psychology: Guide to Master Your Mind in 5 Steps

May 24, 2023
3k
Trading Psychology: 7 Keys to Successful Trading 6
Technical Analysis

Trading Psychology: 7 Keys to Successful Trading

May 22, 2023
3k

Leave a Reply Cancel reply

Your email address will not be published. Required fields are marked *

Follow Us

Facebook-f Twitter Instagram Linkedin-in Youtube Telegram

Register on Elearnmarkets

Continue your financial learning by creating your own account on Elearnmarkets.com

Register Free Account

Download App

Categories

  • Basic Finance
  • Derivatives
  • Financial Planning
  • Fundamental Analysis
  • Technical Analysis
  • Marketshala
  • Miscellaneous

Popular On Elearnmarkets

  • Market Superheroes:
  • Vivek Bajaj
  • Chetan Panchamia
  • Ashish Kyal
  • Premal Parekh
  • Abhijit Paul
  • Jegan
  • Sivakumar Jayachadran
  • Vishal Malkan
  • Jyoti Budhia
  • Vivek Gadodia
  • Vishal Mehta
  • Piyush Chaudhry
  • Santosh Pasi
  • Gomathi Shankar
  • Market Superheroes:
  • Vivek Bajaj
  • Chetan Panchamia
  • Ashish Kyal
  • Premal Parekh
  • Abhijit Paul
  • Jegan
  • Sivakumar Jayachadran
  • Vishal Malkan
  • Jyoti Budhia
  • Vivek Gadodia
  • Vishal Mehta
  • Piyush Chaudhry
  • Santosh Pasi
  • Gomathi Shankar
  • Courses:​
  • Options Trading
  • Dow Theory
  • Momentum Trading
  • Stock Investing
  • Stock Market for Beginners
  • Harmonic Chart Patterns
  • Algo Trading
  • Elliot Wave Theory
  • Advanced Excel
  • Cryptocurrency
  • NSE Certification Course
  • Courses:​
  • Options Trading
  • Dow Theory
  • Momentum Trading
  • Stock Investing
  • Stock Market for Beginners
  • Harmonic Chart Patterns
  • Algo Trading
  • Elliot Wave Theory
  • Advanced Excel
  • Cryptocurrency
  • NSE Certification Course
  • Webinars:
  • Bank Nifty Scalping
  • Intraday Trading Strategies
  • Options Trading Strategies
  • Options selling
  • Price Action
  • Relative Strength
  • Tax Planning
  • Options Buying
  • Growth Stocks
  • Portfolio Management
  • Relative Strength Index
  • Risk Management
  • Renko Charts
  • Crude Oil
  • Traders Psychology
  • Moving Average
  • Multibagger Stocks
  • Free Learning Modules:
  • Intraday Trading
  • Options Scalping
  • Swing Trading
  • Financial Modelling
  • RSI Indicator
  • Bollinger Bands
  • Pricing of Futures
  • Personal Finance
  • Initial Public Offerings (IPO)
  • Value Investing
  • Technical Indicators
  • Candlesticks
  • Chart Patterns
  • Option Greeks
  • ELSS Funds
  • Banking and Insurance
  • Real Estate
  • Gold
  • Book Summaries:
  • Rich Dad Poor Dad
  • Psychology of Money
  • The Intelligent Investor
  • The Richest Man in Babylon
  • Think and Trade Like a Champion
  • Value Investing and Behavioural Finance
  • Trading in the Zone
  • Learn to Earn
  • Book Summaries:
  • Rich Dad Poor Dad
  • Psychology of Money
  • The Intelligent Investor
  • The Richest Man in Babylon
  • Think and Trade Like a Champion
  • Value Investing and Behavioural Finance
  • Trading in the Zone
  • Learn to Earn
  • Tools:
  • CAGR Calculator
  • SIP Calculator
  • eLearnOptions
  • Future Value Calculator
  • Present Value Calculator
  • Atal Pension Yojana
  • Cost of Delay Calculator
  • Become a Crorepati
  • Tools:
  • CAGR Calculator
  • SIP Calculator
  • eLearnOptions
  • Future Value Calculator
  • Present Value Calculator
  • Atal Pension Yojana
  • Cost of Delay Calculator
  • Become a Crorepati

© 2023 Elearnmarkets. All Rights Reserved

  • Visit Elearnmarkets
  • Courses
  • Webinars
  • Financial Guides
  • Get Free Counselling
  • Visit Elearnmarkets
  • Courses
  • Webinars
  • Financial Guides
  • Get Free Counselling

Get Elearnmarkets App

No Result
View All Result
  • Article Categories
    • Basic Finance
    • Derivatives
    • Financial Planning
    • Fundamental Analysis
    • Technical Analysis
    • Marketshala
    • Miscellaneous
  • Language
    • Hindi
    • Bengali
    • English
  • Courses
  • Webinars

© 2020 Elearnmarkets All Rights Reserved