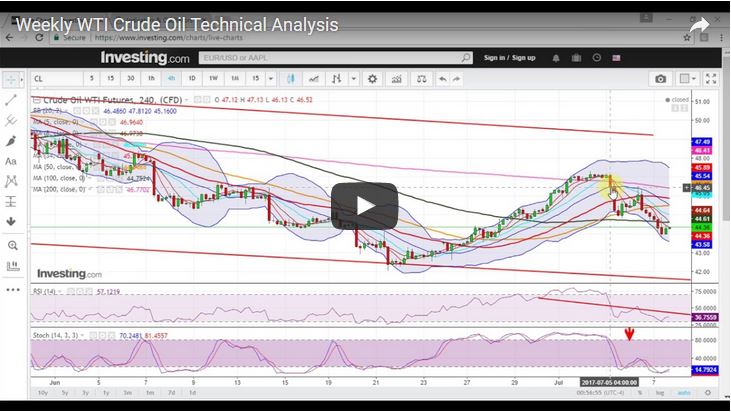
WTI (Close approx. 44.23): WTI crude continued the uptrend on Monday. The Tuesday it formed a doji candlestick pattern in daily chart (below) and oil sold off sharply on Wednesday from approx. 50 day moving average and a fresh downtrend started that continued till Friday. The confirmation of downtrend was provided by slow stochastic entering into normal region from overbought region.
In the 4-Hourly chart below we can see that there was as clear bearish engulfing pattern in chart that triggered the down move. Someone could have sold at that or in a pull back to 4-Hourly mid-Bollinger as shown in the chart below. The following down move was very rewarding.
Also, we can seen that in the latest down move the CL contract has not closed above 4-hourly 5 sma so far in the move. Going forward we have to track this moving average in 4 hourly chart to understand the characteristics of the move or for getting an early indication of any potential reversal.
At present the WTI contract is below all near term moving averages. Also stochastic has come down along with RSI. In this scenario, if down trend is continued, the contract can continue moving lower towards the trend channel support at approx. 41.50 that is indicated in the daily chart. If there is any change of trend, early indications can be tracked from shorter term technical (hourly/2-hourly/4-hourly).
Disclaimer
Elearnmarkets wants to inform you that this post/video is solely for educational purpose. We are not advising any trading or investment ideas. We want to add that the data/indicator/signals contained in this website/post/video are not necessarily real-time nor accurate. All CFDs/traded instruments (stocks, indexes, futures, commodities) and Forex prices are not provided by exchanges but rather by web based charting platforms, and so prices/indicators may not be accurate and may differ from the actual market prices, meaning prices are indicative and not appropriate for trading or investing purposes. Therefore, Elearnmarkets doesn`t bear any responsibility for any trading losses you might incur as a result of using this data/ indicators/charting platform. This analysis is purely based on the technical observations and not meant for investing with real money. Elearnmarkets does not have any position in the market. One can create position in market at his/her own risk.
Elearnmarkets or anyone involved with Elearnmarkets will not accept any liability for loss or damage as a result of reliance on the information including data, quotes, charts and buy/sell signals/discussions contained within this website/post. Please be fully informed regarding the risks and costs associated with trading the financial markets, it is one of the riskiest investment forms possible.


