
Chart patterns play a crucial role when analyzing charts for trading. In technical analysis, the transitions in the trends are signalled by these charts’ patterns.
By learning about these chart patterns, you will be able to learn how to profit from these technical price patterns. But before you start analyzing these patterns, it’s better to learn about them.
In order to get grips with them, here are the top 10 chart patterns that every trader should know when trading in the stock market. But before knowing that let us discuss the basics of the chart patterns:
Table of Contents
What are Chart Patterns?
Chart patterns put all buying and selling that’s happening in the stock market into a concise picture. It provides a complete pictorial record of all trading and a framework for analyzing the battle between bulls and bears.
Chart patterns can help us in determining who is winning the battle, and also allow traders to position themselves accordingly. Chart pattern analysis can be used to make short-term as well as long-term forecasts.
The data used by the chart patterns can be intraday, daily, weekly, monthly or yearly. Gaps and reversals may form in one trading session, while broadening tops and dormant bottoms may require many months to form.
Why is it Important to analyze the Chart Patterns?
Chart patterns are a great way of viewing price actions which occur during the stock trading period.
Chart patterns tend to repeat themselves over and over again which helps to appeal to human psychology and trader psychology in particular.
If you are able to learn to recognize these patterns early they will help you to gain a real competitive advantage in the markets.
Just as volume, support and resistance levels, RSI, Fibonacci Retracements and other technical indicators, stock chart patterns helps in identifying trend reversals and continuations.
Types of Chart Patterns:
Chart patterns can be basically classified into:
- Continuation patterns: These kinds of chart patterns give continuation signals of the ongoing trend
- Reversal Patterns: These kinds of chart patterns give reversal signals
- Bilateral Patterns: These kinds of chart patterns shows uncertainty and high volatility in the market.
Below is the 10 most useful trade chart patterns poster:

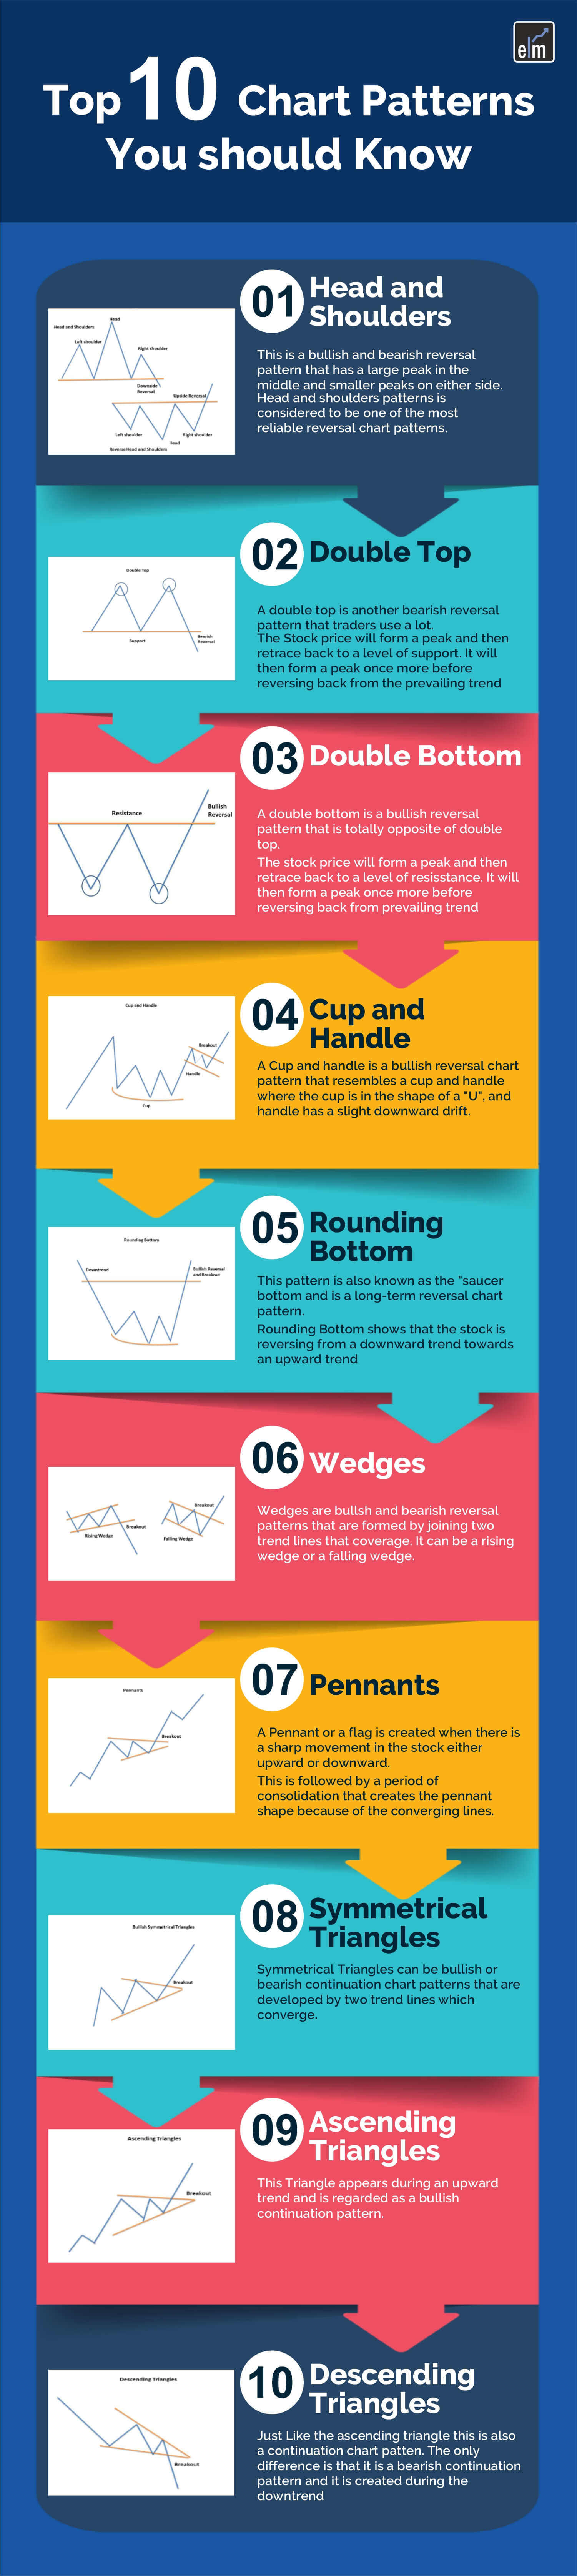
1. Head and Shoulders
This is a bullish and bearish reversal pattern which has a large peak in the middle and smaller peaks on either side. The head and shoulders chart pattern is considered to be one of the most reliable reversal chart patterns.
This pattern is formed when the prices of the stock rise to a peak and fall down to the same level from where it had started rising. Again the prices rise and form a peak higher than the last peak and again it declines to the original base.
Prices again rise to form a third peak, which is lower than the second peak and from here it starts declining to the base level. When the prices break the baseline with volume then bearish reversal takes place.
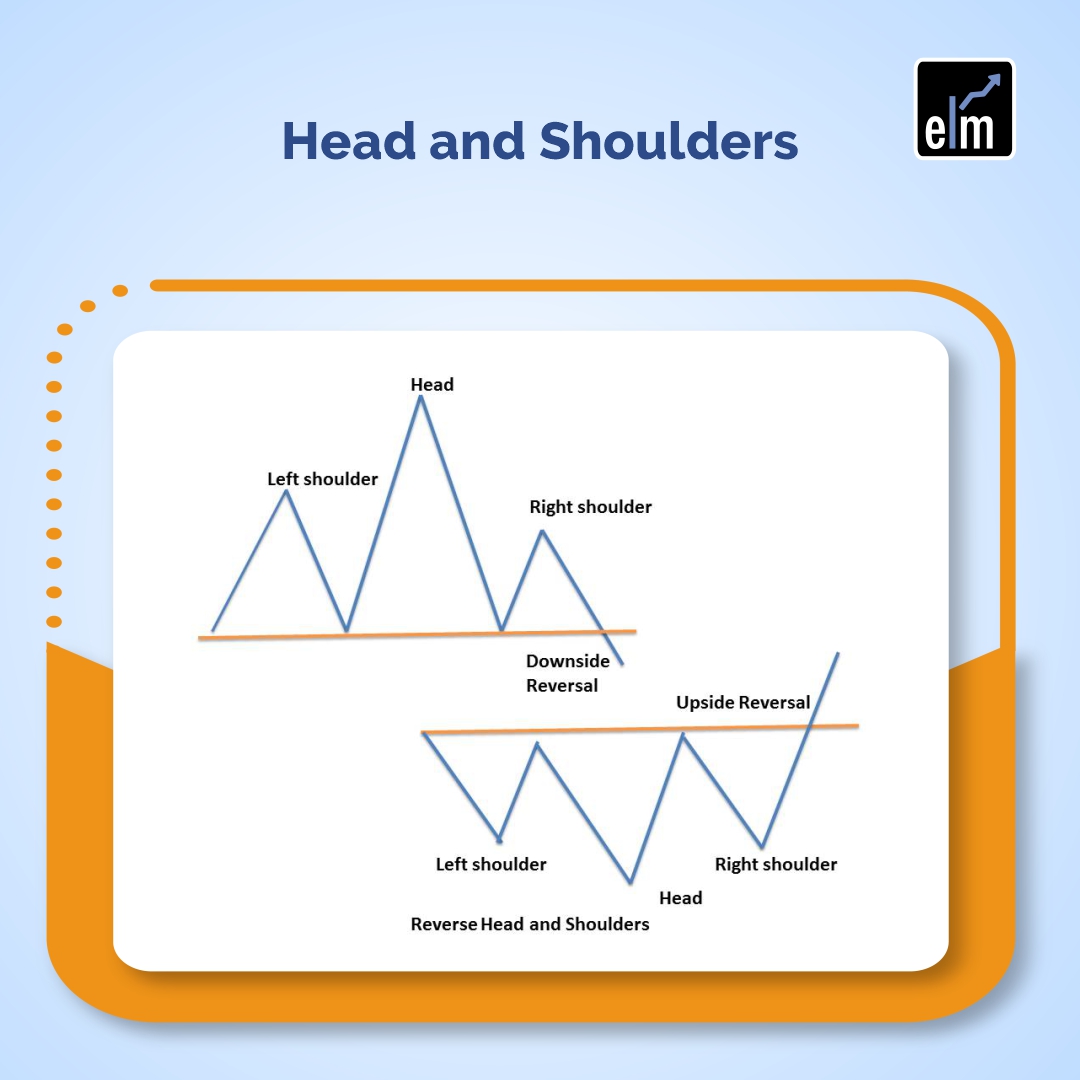
2. Double top
A double top is another bearish reversal pattern that traders use a lot.
The stock price will form a peak and then retrace back to a level of support. It will then form a peak once more before reversing back from the prevailing trend.
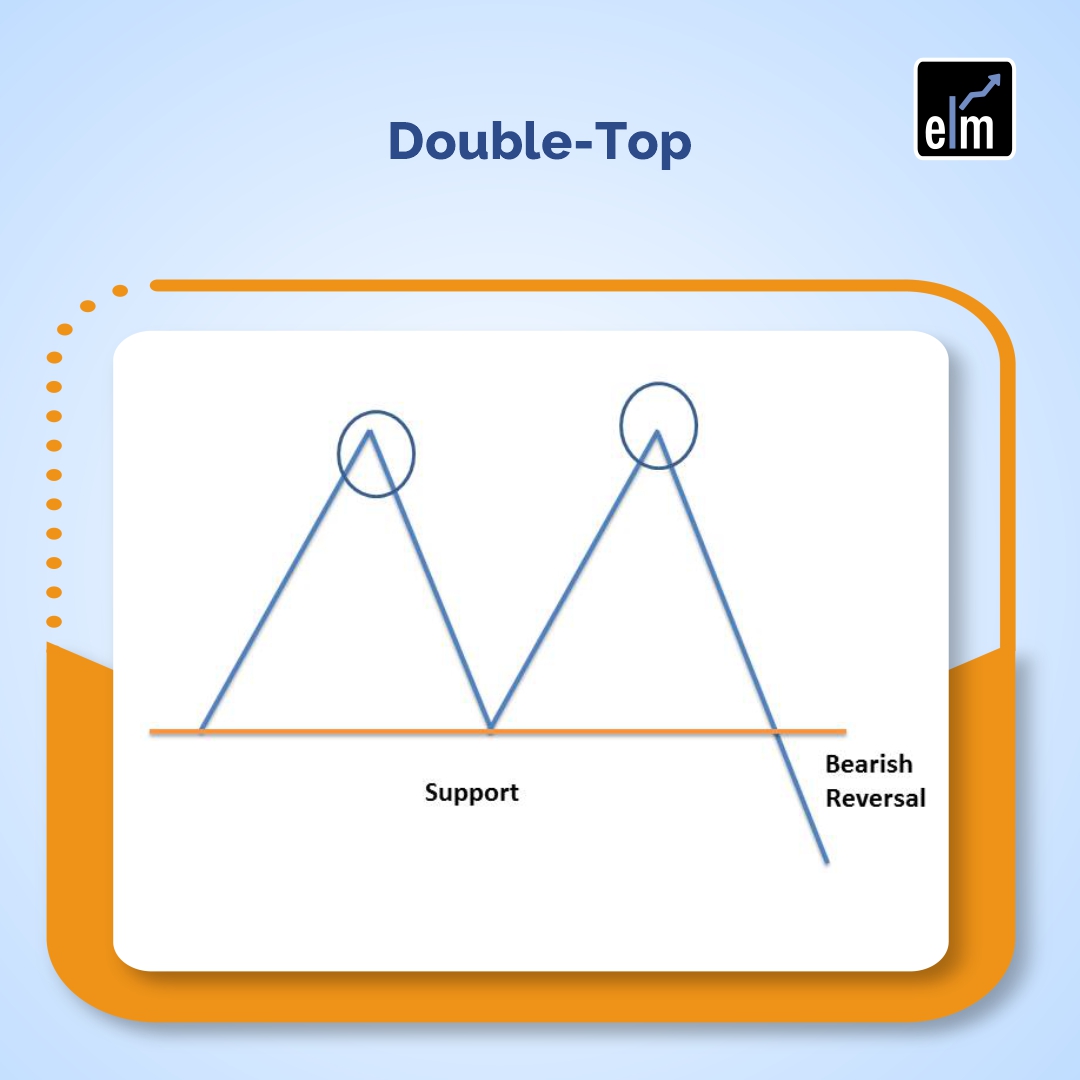
3. Double Bottom
A double bottom a.k.a W pattern is a bullish reversal pattern that is totally opposite of a double top.
The stock price will form a peak and then retrace back to a level of resistance. It will then form a peak once more before reversing back from the prevailing trend.
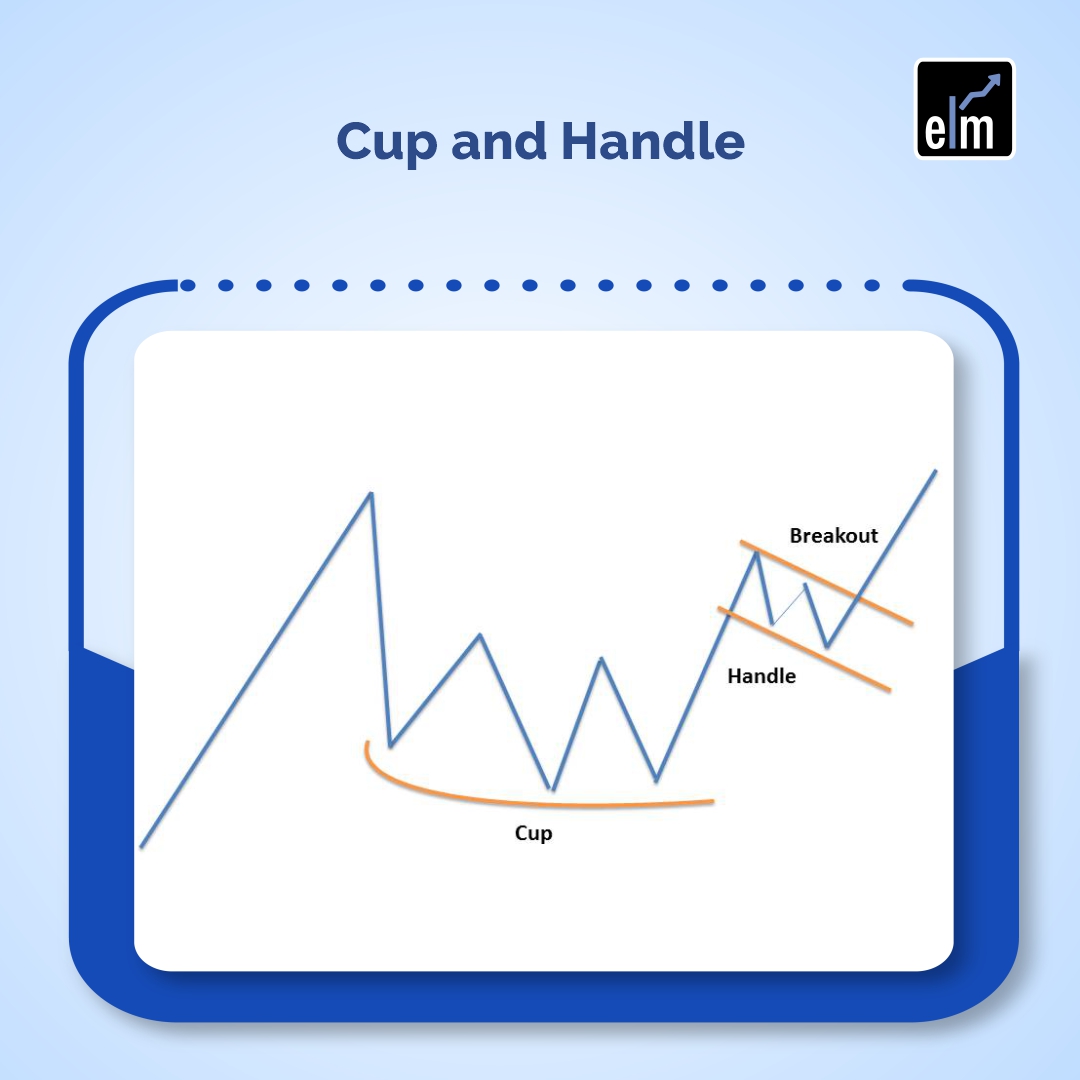
4. Cup and Handle
A cup and handle is a bullish reversal chart pattern which resembles a cup and handles where the cup is in the shape of a “U” and the handle has a slight downward drift.
The cup appears similar to a rounding bottom chart pattern, and the handle is similar to a wedge pattern.
The right-hand side of the pattern has a low trading volume that may be as short as seven weeks or as long as 65 weeks.
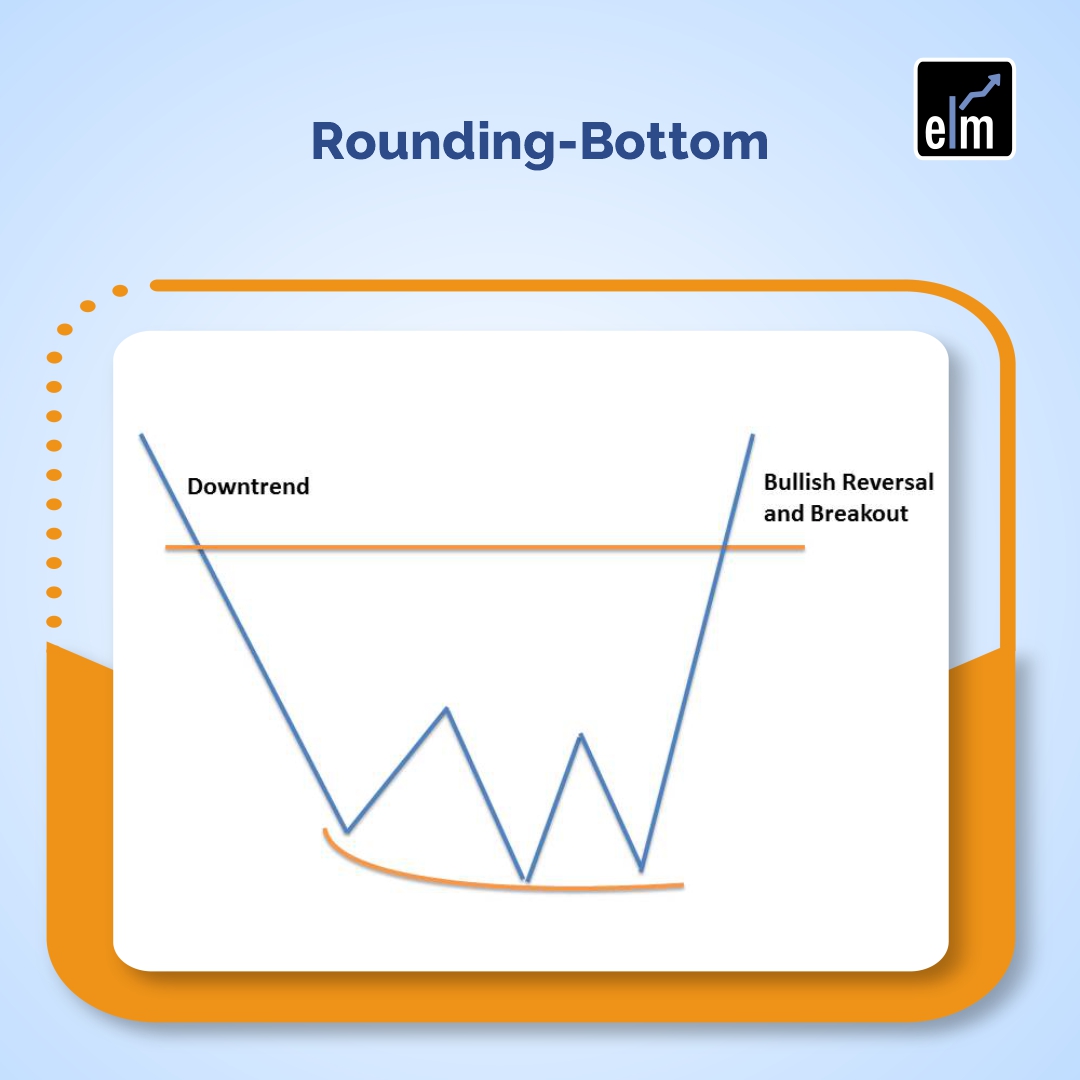
5. Rounding Bottom
This pattern is also known as the “saucer bottom” and is a long-term reversal chart pattern. Rounding Bottom shows that the stock is reversing from a downward trend towards an upward trend.
It can take any time from several months to years to form. It is very similar to the cup and handle, but the only difference is that there is no handle to the pattern.
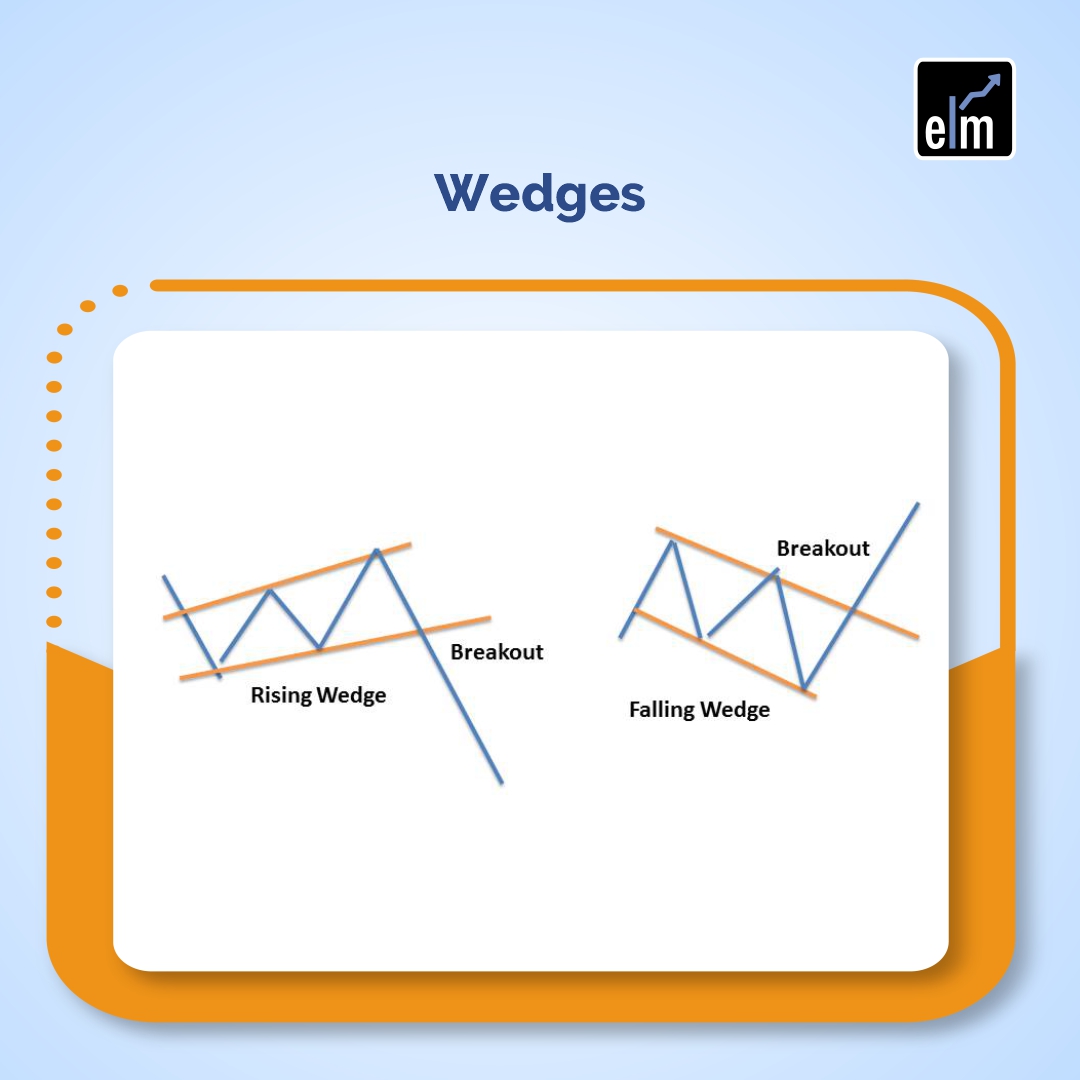
6. Wedges
Wedges are bullish and bearish reversal as well as continuation patterns which are formed by joining two trend lines that converge. It can be a rising wedge or a falling wedge.
A rising wedge occurs when the price of the stock is rising over time whereas a falling wedge occurs when the price of the stock is falling over time.
A wedge pattern can be drawn by using trend lines and connecting the peaks and the troughs. Once there is a price breakout, there is a sharp movement of prices in either of the directions.
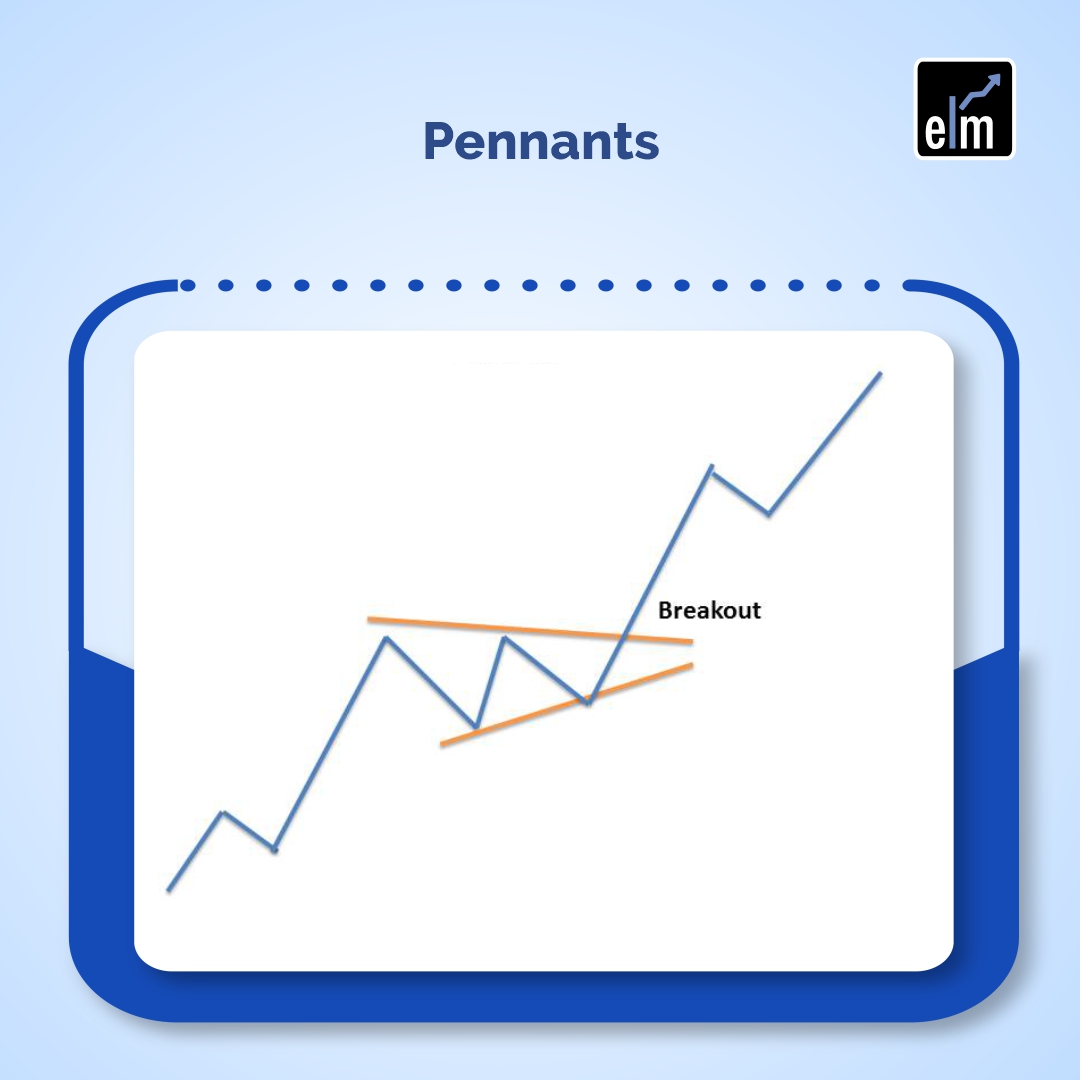
7. Pennants
A pennant pattern or a flag pattern is created when there is a sharp movement in the stock either upward or downward. This is followed by a period of consolidation that creates the pennant shape because of the converging lines.
Then a breakout movement occurs in the same direction as the big stock move. Pennant patterns are similar to flag patterns and tend to last between one and three weeks.
At the initial stock movement, there is a significant volume which is followed by weaker volume in the pennant section and then a rise in the volume at the breakout.
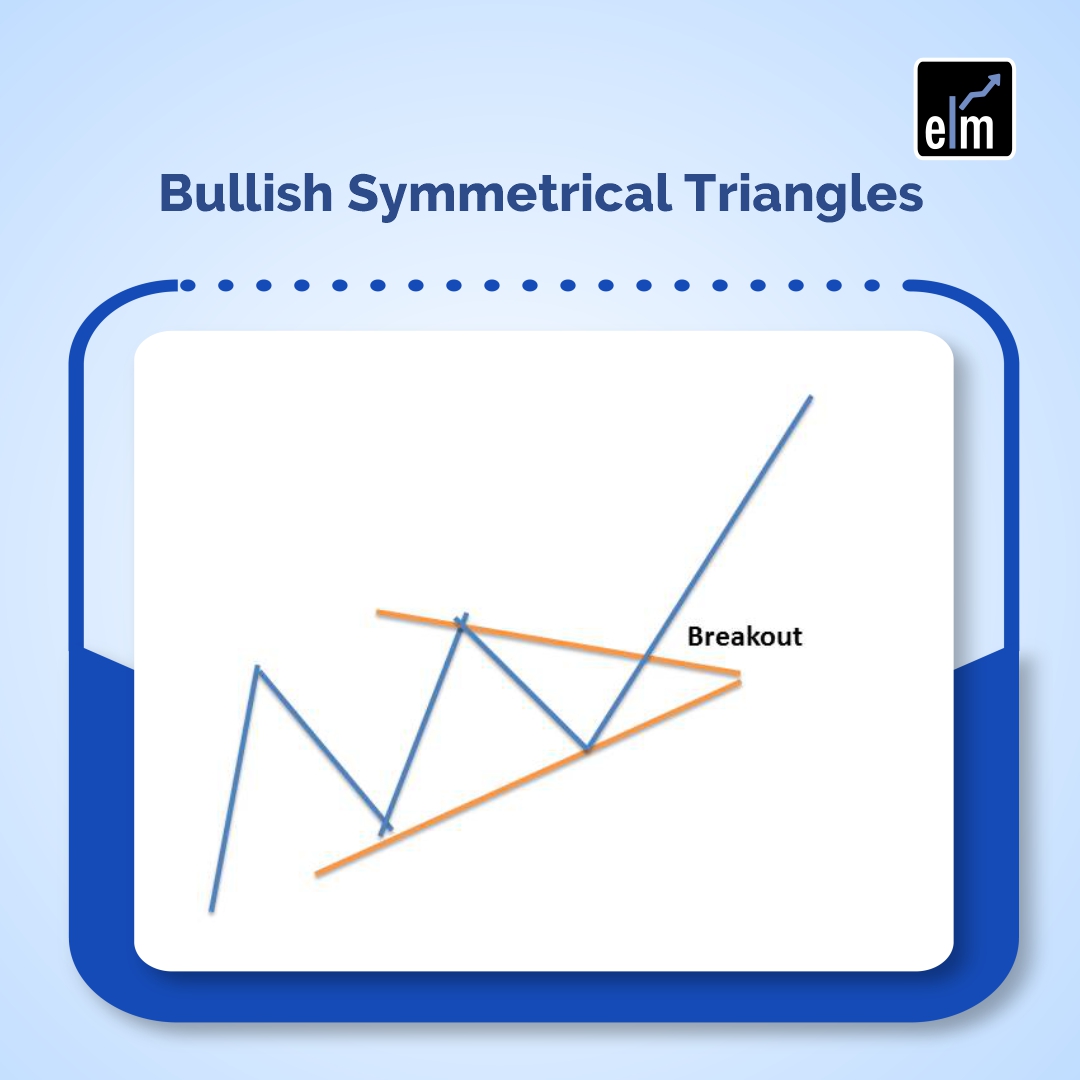
8. Symmetrical Triangles
Symmetrical Triangles can be bullish or bearish continuation chart patterns that are developed by two trend lines that converge. These two trend lines join the peaks and troughs and they occur in the direction of the ongoing trend.
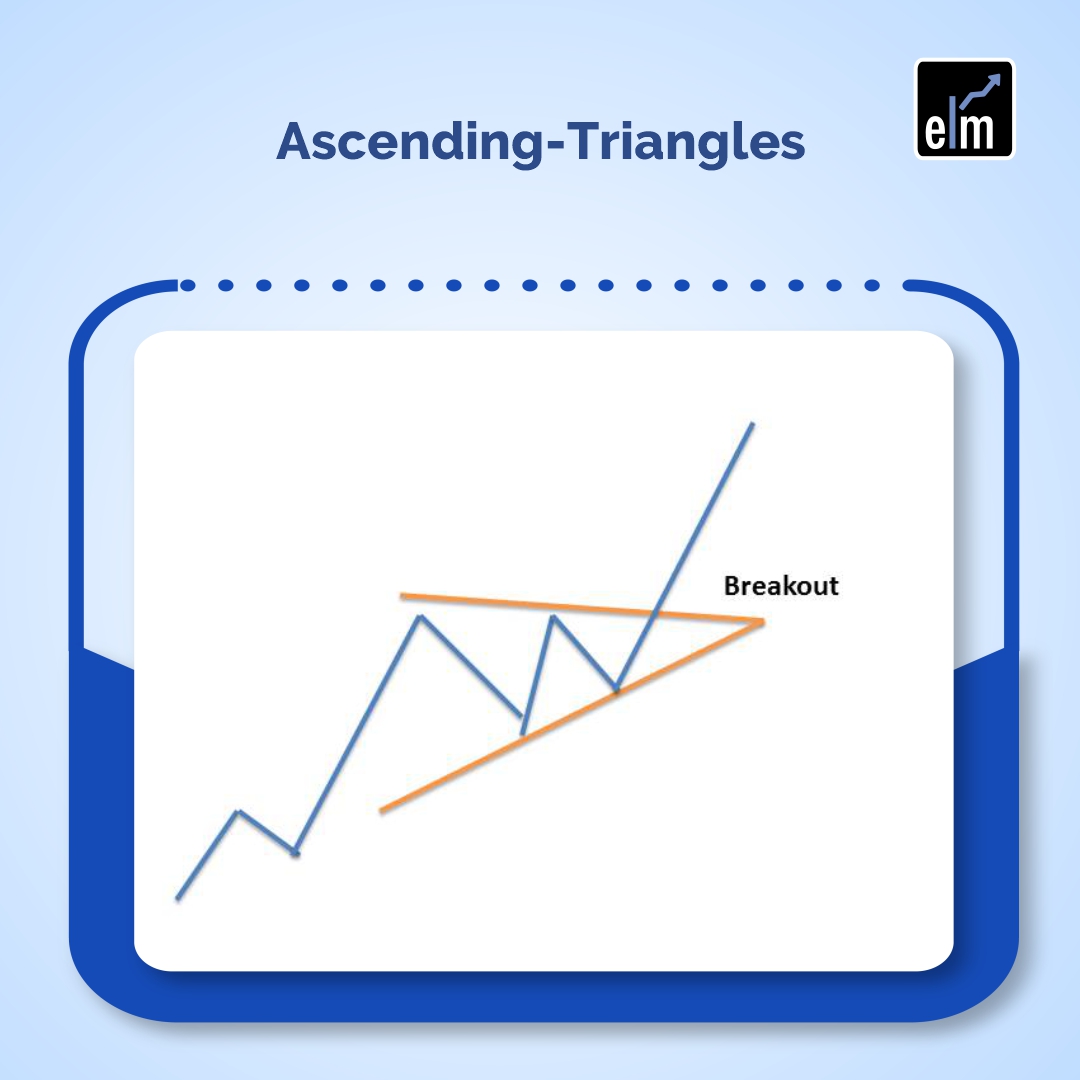
9. Ascending Triangles:
This triangle appears during an upward trend and is regarded as a bullish continuation pattern.
Sometimes it can be also created at the end of a downward trend as a reversal pattern, but it is more commonly considered as a continuation chart pattern.
Ascending triangles are always regarded as bullish patterns whenever they are formed in the charts.
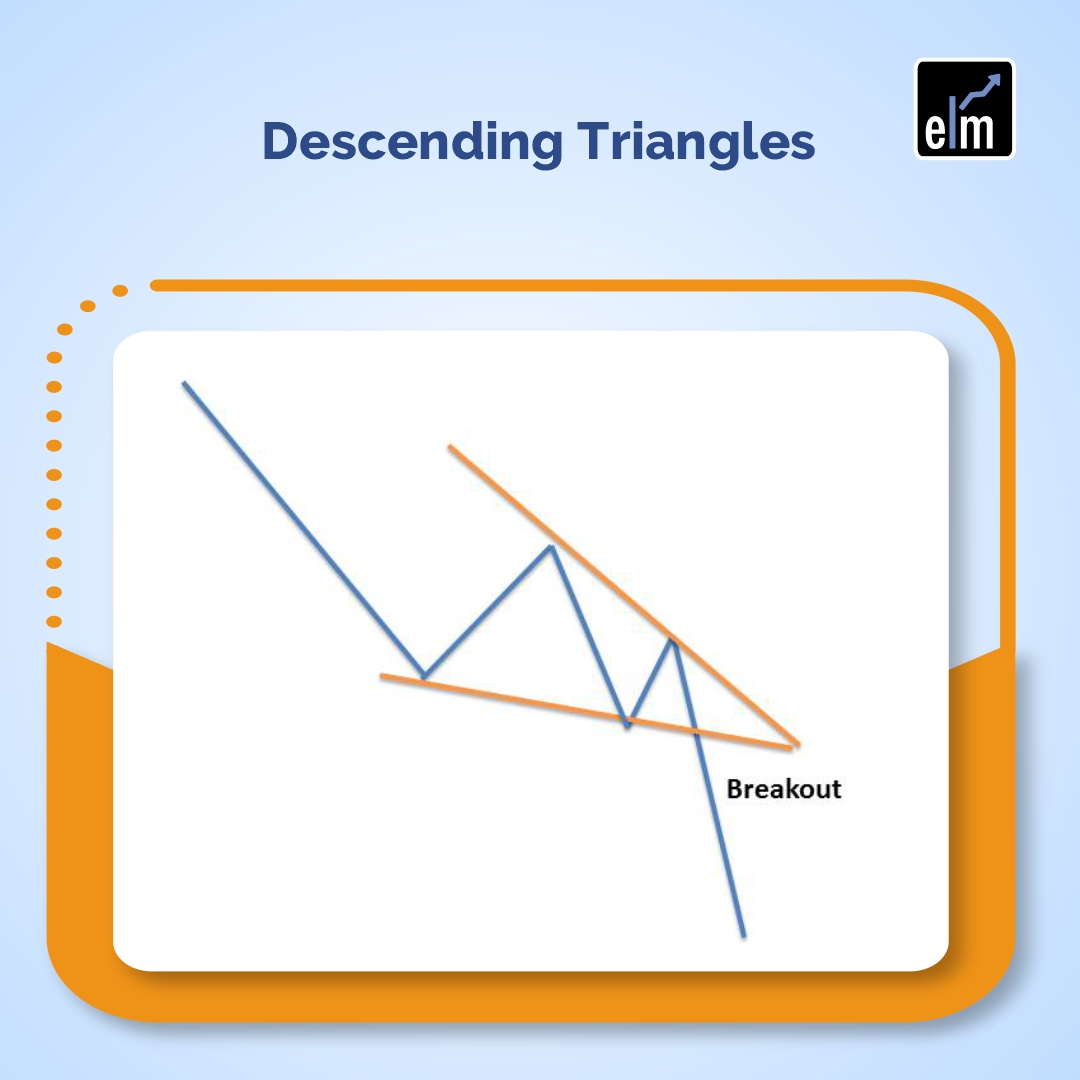
10. Descending Triangles
Like the ascending triangle, the descending triangle is a continuation chart pattern. The only difference is that it is a bearish continuation pattern and it is created during the downtrend.
Sometimes it can be also created at the end of an uptrend as a reversal pattern, but it is more commonly considered as a continuation chart pattern.
If you’re interested in learning more about how candlesticks work, join our Candlestick Patterns Course developed by Market Experts
How to use Chart Patterns Scanners in StockEdge?
StockEdge has developed a deeper analysis of stock charts and has developed this unique feature to identify some key chart patterns in StockEdge charts for you; you will receive a list of stocks where respective chart patterns have recently formed, allowing you to capitalize on trade opportunities as soon as a chart pattern is formed.
The StockEdge Pro version has five categories of chart patterns. There are 12′ unique chart pattern types covering bullish, bearish, and neutral momentum:
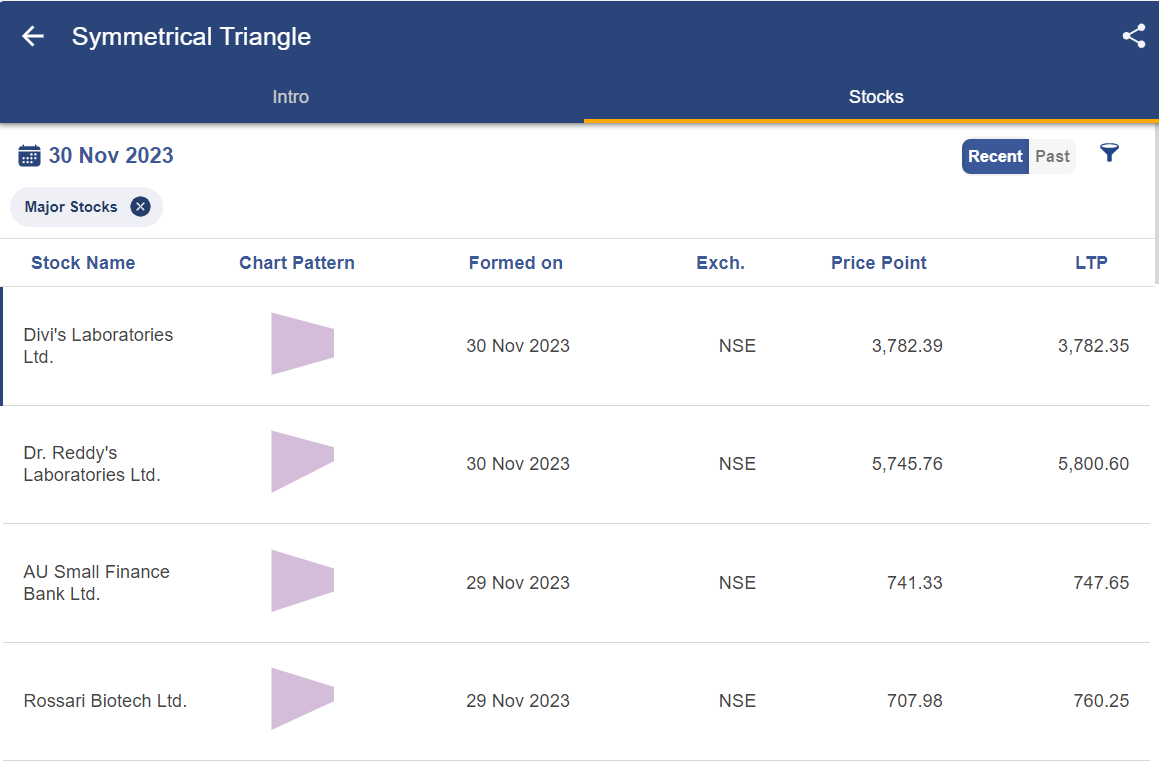
After clicking on any of the above chart patterns, you will get a list of different types of that particular chart pattern, for example, when we click on Triangle patterns, we will get the list as shown below:
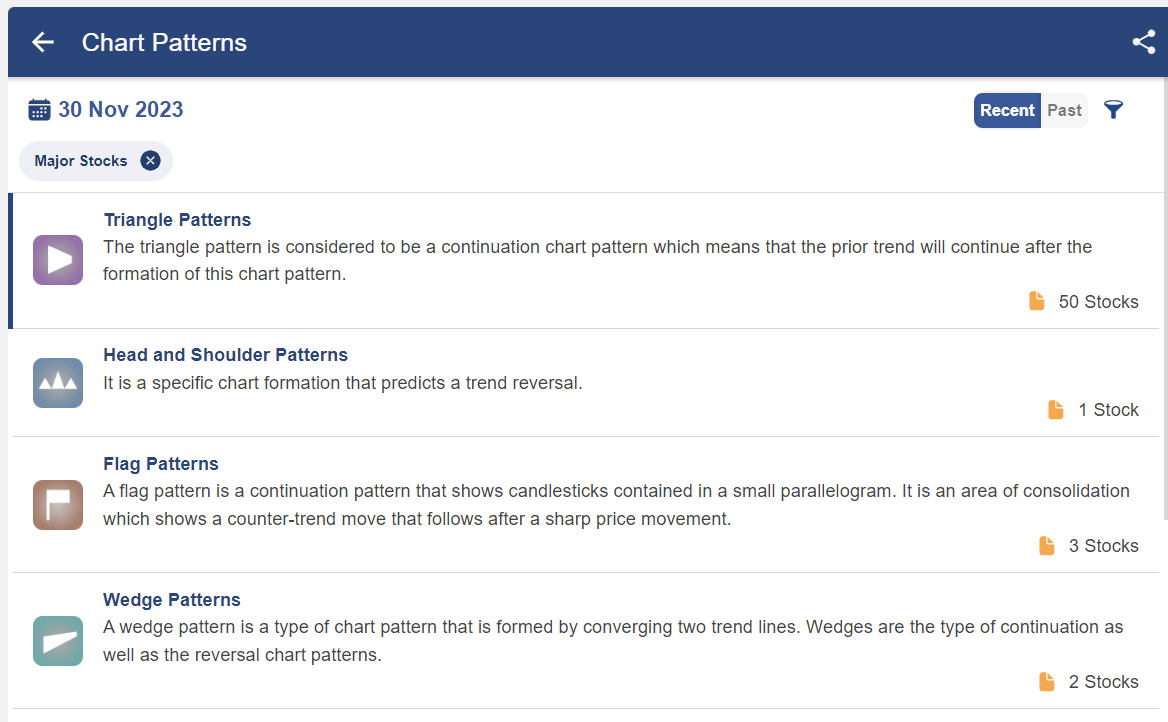
To get the list of stocks exhibiting a particular type of chart pattern, click on the name of that chart pattern:
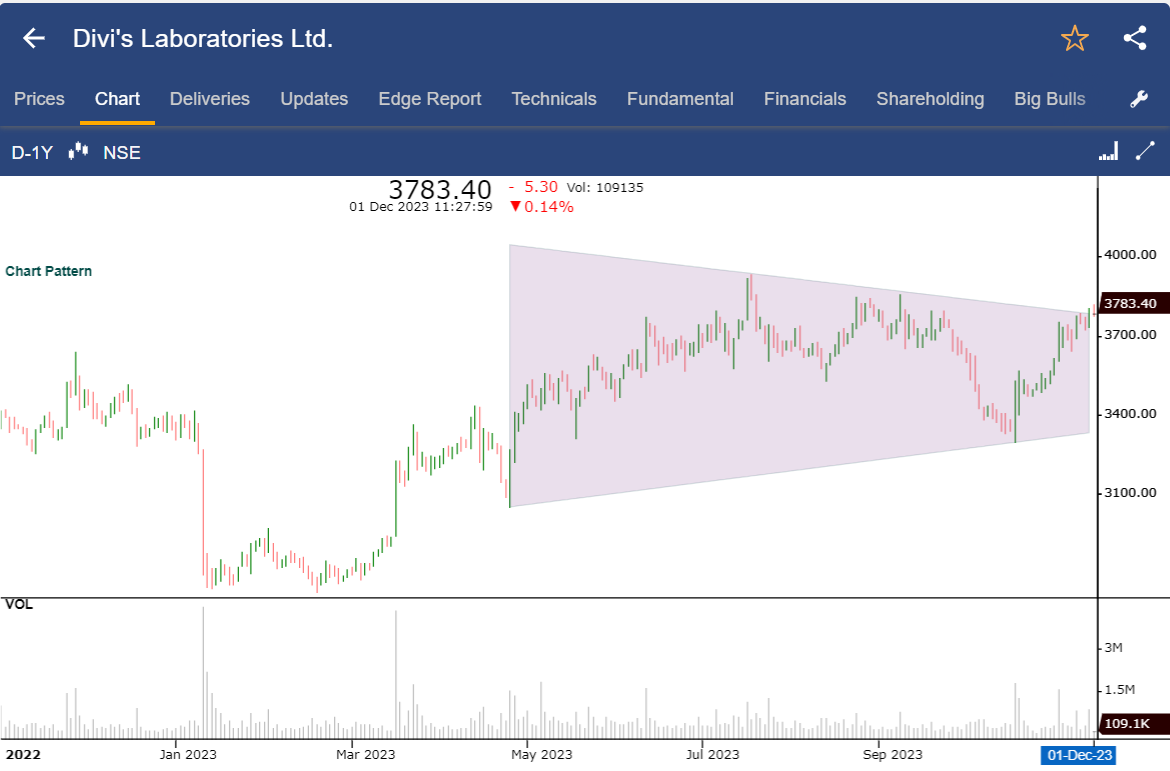
By clicking on the stock’s name, the stock chart will be shown below:
You can also watch our video below–
Begin your journey into trading confidently! Explore essential chart patterns with our stock market courses for beginners. Enroll now for success!
Bottomline
All of the patterns described in this article serve as helpful technical indicators that can be used to determine future price movements of an asset as well as the reasons for past price movements. This is so that traders may choose whether to open a long or short position, whether to close out their open positions in the case of a potential trend reversal, and other important trading decisions. Chart patterns are capable of indicating areas of support and resistance.
You can learn more about Chart patterns in our trading online course.
Frequently Asked Questions
What is the most successful chart pattern?
The head and shoulders bottom pattern has an accuracy rate of 88 per cent and an average price change of +50 per cent, making it the most effective chart pattern in a bull market.
How many chart patterns are there?
Programmes that are used for charting must rely on specified criteria to match the pattern because pattern recognition is subjective. There are 42 patterns that have been identified, with basic patterns and complicated patterns. Candlesticks were brought to the West by Steve Nison.
What is the secret of chart patterns?
Simply analysing the Trending Move, Retracement Move, and swing highs/lows is all you need to do in order to grasp any chart pattern. When you trade with the trend, start from a place of value, and trade breakouts with a buildup, chart patterns perform well.
What are the 3 main groups of chart patterns?
Patterns can be divided into three categories: bilateral, reversal, and continuation. Bilateral patterns are a subset of trading patterns that include ascending, descending, and symmetrical triangles. Some traders only include symmetrical triangles in the bilateral category.


")
Basic and very essential knowledge about chart patterns, explained easily and briefly.
Excellent teaching of Chart Patterns
Hi,
Thank you for Reading!
Keep Reading!
HI, SIR,
AWESOME TEACHING OF CHART PATTERNS
THANK YOU VERY MUCH😃👌🏻
Hi,
We really appreciated that you liked our blog! Thank you for your feedback!
Keep Reading!
Hi Sakshi,
Awesome. Explained very simple way and in detail. Thanks a lot!
Thank you,
Praveen
Hi,
We really appreciated that you liked our blog!
Thank you for Reading!
Keep Reading!
Very good
Hi,
We really appreciated that you liked our blog!
Thank you for Reading!
Keep Reading!