Trading security based on chart patterns is quite a common phenomenon in the market. This is usually formed when the price of a security moves in a fashion which resembles a shape in the form of a rectangle, rounding, triangle, cup and handle pattern, etc.
The good thing about the pattern is that they can be easily located along with a proper entry point with predefined risk-reward.
| Table of Contents |
|---|
| What is Cup and Handle Pattern? |
| List of Important Points |
| Cup and Handle Pattern Example |
These patterns are nothing but simple tools that work in understanding trading through technical analysis.
Today in this article, we will talk about Cup and Handle pattern, how to trade it, and things you should keep in mind for a profitable trade setup.
What is Cup and Handle Pattern?
It was developed by William O Neil and was first discussed in his book “How to make money in stocks”.
The cup and Handle pattern is one of the most important chart patterns to make money in the stock market.
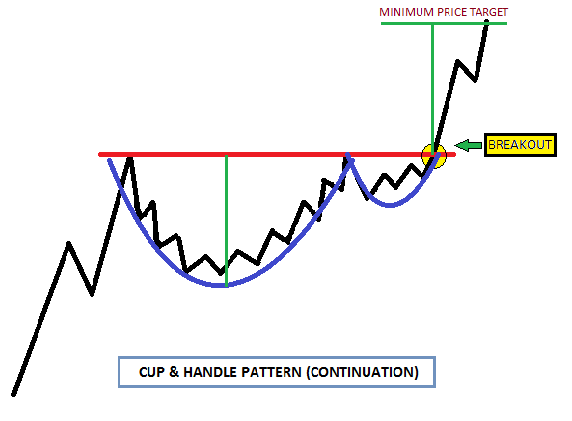
The Cup is usually U-shape and the handle is basically the retracement from the prior top to about 1/3rd of the vertical height of the cup and looks quite similar to a bowl. This pattern simply shows a period of consolidation followed by a breakout.
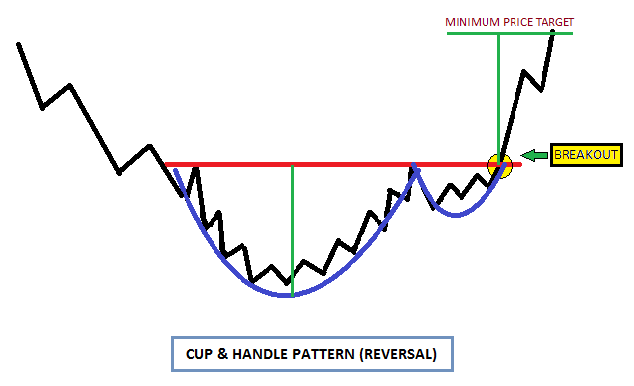
Cup and Handle patterns can be seen both as bullish continuation or reversal patterns.
A continuation pattern is formed when there is a prior uptrend, followed by a consolidation in the form of Cup and Handle pattern and then the uptrend continues post-breakout.
On the other hand, a reversal pattern occurs after a prolonged downtrend and reverses the prior trend.
This can be formed in any timeframe from a few minutes to weekly and monthly charts. However, the higher the timeframe, the better the chances of success post-breakout.
List of Important points:
1.Cup
The Cup is usually “U” shaped and may be considered as a rounding bottom with almost equal highs on either side. However, a “V” shaped cup also qualifies as a Cup and Handle pattern but the conviction is higher in “U” shaped due to the consolidation at the bottom.

2.Handle
The handle is usually the pullback from the higher end of the cup which may be rounding, triangle, or a descending channel. Usually, the pullback is about 1/3rd of the size of the prior advance.
Learn to trade with Technical analysis made easy course by Market Experts
The smaller the pullback, the better is the strength of the formation and the higher the possibility of a breakout.
3.Volume pattern
The breakout from the handle’s resistance should be accompanied by increased volume thus confirming the same.
4.Period
The cup usually forms over a period of 1-6 months or even longer those formed in weekly and monthly charts. The handle ideally forms over a span of 1-4 weeks or even higher depending upon the time period of the cup.
5.Target
The projected target from the breakout is usually the vertical distance from the high to the bottom of the cup.
6. Stop loss
Traders may place a stop loss at the lowest point of the handle and may trail it to a recent swing low as the stock makes a higher high within the consolidation area of the handle; depending upon the risk appetite of the trader.
Also Read: Important Chart Patterns to Make Money in Stock Market
Cup and Handle Pattern Example
Let’s understand this pattern with help of examples.
Scenario 1: As a Continuation pattern
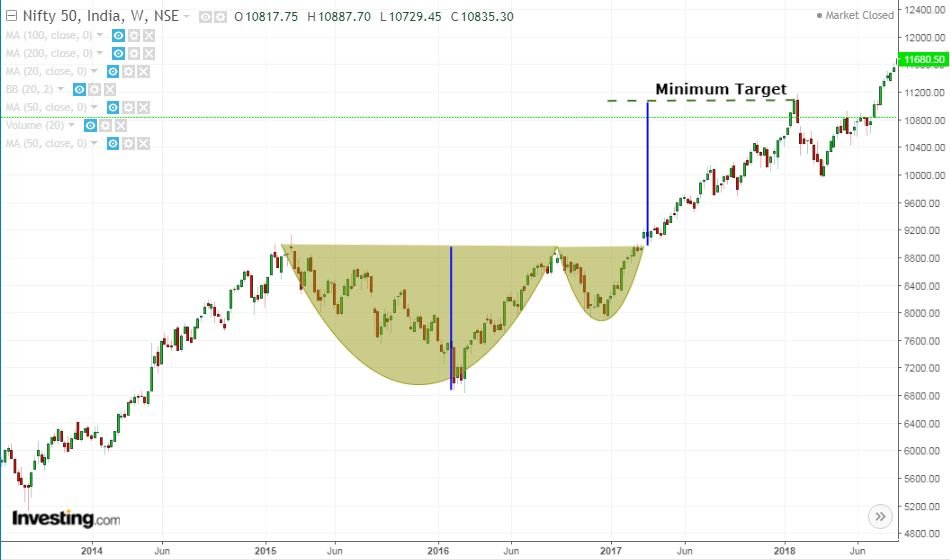
This is an example of Cup and Handle as a continuation pattern in Nifty news which was formed in a span of about 2 years. The index witnessed a breakout from the pattern along with a gap up which confirmed further strength.
The minimum target shown by a vertical blue line (distance from high to bottom of the cup) got achieved in less than a year’s time.
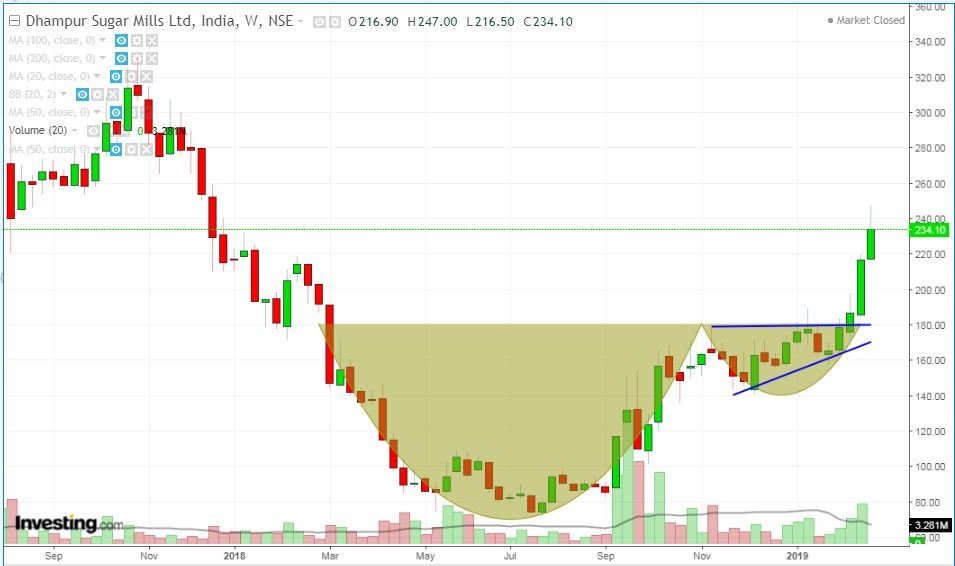
Scenario 2: As a reversal pattern
This is another example of Cup and Handle pattern is a reversal pattern that was recently formed in Dhampur Sugar.
If you look at the handle, it looks more of an Ascending triangle breakout and the stock witnessed a sharp rally post-breakout in a span of just 2-3 weeks. However, the minimum target is yet to be achieved in this stock which may unfold in the coming weeks.
The good thing about Cup and handle pattern is that it has a high success ratio along with a good risk reward. But you should not forget to place your stop loss and trail your SL as the price goes up.
Moreover, you should closely monitor the volume as the breakouts with low volume is less likely to sustain. You may also confirm the strength of breakout based on other technical parameters.
Happy Learning!


Respect to post author, some excellent information .