How to generate powerful trading signals using Parabolic SAR and RSI?
Parabolic SAR is a price and time based technical analysis tool which works very well in the trending market and ...
Take your skills to the next level with our advanced guide. Learn advanced techniques and strategies to stay ahead in your field.
Parabolic SAR is a price and time based technical analysis tool which works very well in the trending market and ...
Williams % R for Trading Strategies is a very simple but effective is a technical analysis oscillator described by Lary ...
Key Takeaways: Developed by J. Welles Wilder, Jr. during the 1970s, helps to quantify the changes in price and their ...
The Stochastic Indicator, developed by George C. Lane in the late 1950’s is one of the most popular members of ...
According to Wikipedia, Causality (also referred to as causation, or cause and effect) is the agency or efficacy that connects ...

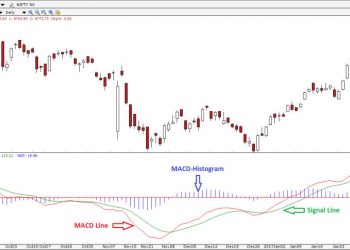
MACD Indicator- We, the Homo sapiens, want to live within our comfort zone. We love to change but hate being ...

Since time immemorial when Adam was tempted for the apple to go to the Tree of Knowledge until the very ...
A Broadening Triangle is a relatively rare triangle pattern which occurs when there is a lot of volatility in a ...
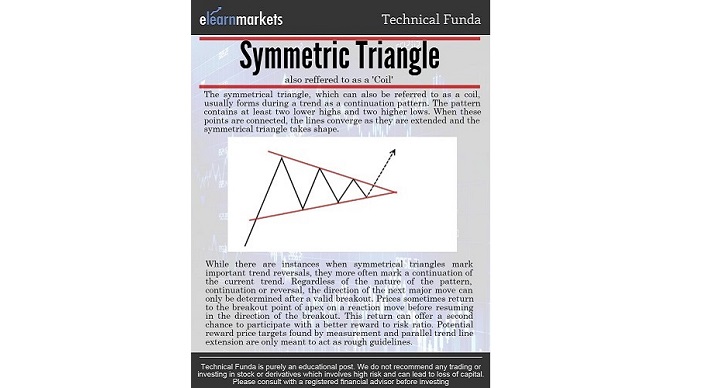
What is a Symmetrical Triangle? Symmetrical Triangle A symmetrical triangle is a technical chart pattern, formed by the fluctuations ...
Key Takeaways: RSI indicator (Relative Strength Index) is a technical analysis indicator used to measure the change in price momentum. ...
Technical analysis is a vast and diverse field of analysis. It has many tools that make it a successful method ...

If you have been studying and practicing technical analysis for a while now or you are a trader, you must ...