
- Important Rules of WD Gann's Theory of Trading
- 1. Friday Weekly High – Bullish Next Week
- 2. Friday Weekly Low – Bearish Next Week
- 3.Tuesday Lows – Uptrend Marker
- 4. Wednesday Highs—Downtrend Signal
- 5. 4-Week High Breakout – Bullish Indication
- 6. 4-Week Low Breakdown – Bearish Indication
- 7. 30 DMA Breakdown – Trend Reversal Signal
- 8. 5:3 Rise-Correction – Probable Pullback
- 9. 100% Rise Resistance – Strong Price Barrier
- 10. 3-Day High Break – Fourth-Day Surge
- 11. Deeper Correction – Trend Change Warning
- 12. 50% Sell Zone – Critical Support Level
- 13. 9:5 Rise-Correction – Extended Pullback
- 14. Monthly Bottom Pattern – Mid-Term Opportunity
- 15. Monthly Top Pattern – Cautionary Signal
- 16. Volume Spike Signal – Trend Reversal Hint
- 17. Quarterly Breakout – Trend Reversal Alert
- Frequently Asked Questions (FAQs)
If you have been studying and practicing technical analysis for a while now, or you are a trader, you must have heard or seen the name of WD Gann and his theory for trading. Even your list of indicators will have the name of WD Gann at least once.
Now the question arises, who was WD Gann? And why is he sought out even 60 years after his death? Let us find out.
William Delbert Gann, or WD Gann, was born on June 6, 1878. As a finance trader, he started his trading career in 1902 when he was 24. He developed numerous technical analysis tools, such as the WD Gann Angles, Circle of 360, Square of 9, Hexagon, and many others. Most of his works are based on astronomy, geometry, astrology, and ancient mathematics. Most of these were so powerful that they are widely used by traders even today. WD Gann’s theory on intraday trading is one of the most successful methods for day traders now.
Important Rules of WD Gann‘s Theory of Trading
Among the many indicators and technical tools, WD Gann laid down some basic rules to be followed for trading:
1. Friday Weekly High – Bullish Next Week
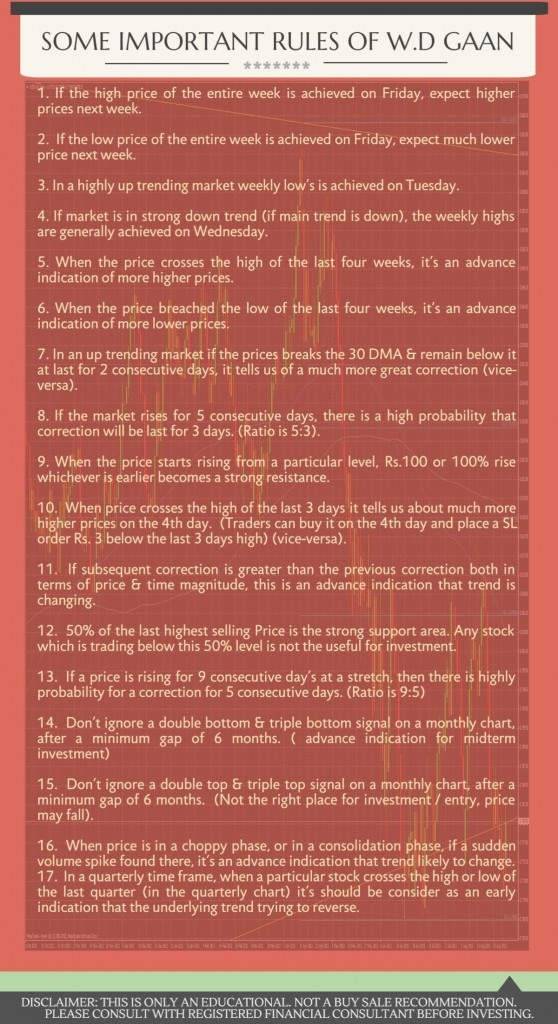
If the high price for the entire week is achieved on Friday, expect higher prices next week.
2. Friday Weekly Low – Bearish Next Week
If the low price for the entire week is achieved on Friday, expect a much lower price next week.
3.Tuesday Lows – Uptrend Marker
In a highly uptrending market weekly low is achieved on Tuesday.
4. Wednesday Highs—Downtrend Signal
If the market is in a strong downtrend (if the main trend is down), the weekly highs are generally achieved on Wednesday.
5. 4-Week High Breakout – Bullish Indication
When the price crosses the high of the last four weeks, it’s an advance indication of more higher prices.
6. 4-Week Low Breakdown – Bearish Indication
When the price breaches the low of the last four weeks, it’s an advance indication of more lower prices.
7. 30 DMA Breakdown – Trend Reversal Signal
In an up trending market, if the prices break the 30 DMA & remain below it at least for 2 consecutive days, it tells us of a much greater correction. (vice-versa)
8. 5:3 Rise-Correction – Probable Pullback
If the market rises for 5 consecutive days, there is a high probability that correction will be lasting for 3 days. (Ratio is 5:3)
9. 100% Rise Resistance – Strong Price Barrier
When the price starts rising from a particular level, Rs.100 or 100% rise whichever is earlier becomes a strong resistance.

10. 3-Day High Break – Fourth-Day Surge
When the price crosses the high of the last 3 days, it tells us about much higher prices on the 4th day. (Traders can buy it on the 4th day and place an SL order Rs. 3 below the last 3 days’ high) (vice-versa)
11. Deeper Correction – Trend Change Warning
If subsequent correction is greater than the previous correction, both in terms of price & time magnitude, this is an advanced indication that the trend is changing.
12. 50% Sell Zone – Critical Support Level
50% of the last highest selling Price is the strong support area. Any stock that is trading below this 50% level is not that useful for investment.
13. 9:5 Rise-Correction – Extended Pullback
If a price is rising for 9 consecutive day’s at a stretch, then there is a high probability of a correction for 5 consecutive days. (Ratio is 9:5)
14. Monthly Bottom Pattern – Mid-Term Opportunity
Don’t ignore a Double Bottom & Triple Bottom signal on a monthly chart, after a minimum gap of 6 months. ( advance indication for mid-term investment)
15. Monthly Top Pattern – Cautionary Signal
Don’t ignore a Double Top & Triple Top signal on a monthly chart, after a minimum gap of 6 months. (Not the right place for investment/entry, the price may fall)
16. Volume Spike Signal – Trend Reversal Hint
When the price is in a choppy phase, or in a consolidation phase, if a sudden volume spike is found there, it’s an advance indication that trend is likely to change.
17. Quarterly Breakout – Trend Reversal Alert
In a quarterly time frame, when a particular stock crosses the high or low of the last quarter (in the quarterly chart), it should be considered as an early indication that the underlying trend is trying to reverse.
Also Read: 15 Gann Techniques Every Trader Should Know
Make sure you do not violate any of these WD Gann trading rules if you decide to make a trade. These rules are essential and play a critical role in your success as a trader. Whenever you close a trade with a loss, review these principles carefully and identify which one you may have violated. Learning from your mistakes is key. Make it a point not to repeat the same error again. Many of these time-tested rules are detailed in various WD Gann books, which remain valuable resources for traders seeking long-term consistency and discipline.
With experience and investigation, you will be able to find the value of the above-stated WD Gann theory. Observation and study will lead you to a correct and practical theory and successful trading in stocks/commodities/currencies.
Though these rules will provide you with the basic guidelines for trading and investing in the Stock Markets, you must know that without proper strategies, all your efforts will be futile.
Frequently Asked Questions (FAQs)
What is the main idea behind WD Gann’s trading rules?
WD Gann’s trading rules identify trend reversals, continuation patterns, and market strength. His principles, such as the “Friday Weekly High” or “4-Week High Breakout,” help traders make informed decisions about entry and exit points. Following these rules can improve trading accuracy and reduce emotional decision-making.
What are some popular WD Gann indicators used in technical analysis?
Some popular WD Gann indicators include the Gann Angles, Square of 9, Circle of 360, and Hexagon. These tools help traders identify key price levels, market cycles, and turning points. They are widely used in volume trading indicator strategies and other technical setups for accurate trend forecasting.
What is WD Gann’s Wheel of 24?
WD Gann’s Wheel of 24 is a tool to forecast market trends by dividing a circle into 24 equal parts. Traders use it to identify key turning points, support and resistance levels, and potential trend reversals, helping in better timing of trades in stocks, commodities, or currencies.
How can traders apply WD Gann’s rules in daily trading?
Traders can use Gann’s rules by observing weekly highs and lows, moving averages, and correction ratios. For example, a “Tuesday Low” often indicates an uptrend, while a “4-Week Low Breakdown” may signal weakness. Combining these with volume trading indicators gives traders a clearer view of market momentum.


I simply could not leave your website prior to suggesting that I really loved the usual information an individual provide for your visitors? Is going to be again incessantly to inspect new posts
You have noted very interesting points! ps nice internet site.