Elearnmarkets - Financial Market Learning
  • Categories
    • Basic Finance
    • Derivatives
    • Financial Planning
    • Fundamental Analysis
    • Technical Analysis
    • Marketshala
    • Miscellaneous
  • Language
    • English
    • Hindi
    • Bengali
No Result
View All Result
  • Courses
  • Webinars
  • Learn On Elearnmarkets
Elearnmarkets - Learn Stock Market, trading, investing for Free
No Result
View All Result
Home Technical Analysis Market Analysis
Nifty Daily Chart

Nifty Rises 2% for the week, Bank and Tech Stocks Provide Leadership

Elearnmarkets by Elearnmarkets
November 18, 2020
in Market Analysis, Market Wrap
Reading Time: 2 mins read
2
51
VIEWS
Share on FacebookShare on TwitterShare on WhatsApp

Nifty (weekly close approx. 10894.7):

This week Nifty opened Gap-up and continued upward journey with Banking and Tech sector providing leadership in this rally which is unfolding with Govt. budget around the corner. The rally got fresh momentum since early profit booking on Wednesday. The Bank Nifty was more bullish compared to Nifty and gave a robust up-move after almost 6 months of tight ranged consolidation. The financial stocks have high weightage in Nifty and any runaway rally in Bank Nifty is likely to pull Nifty in northwards direction.
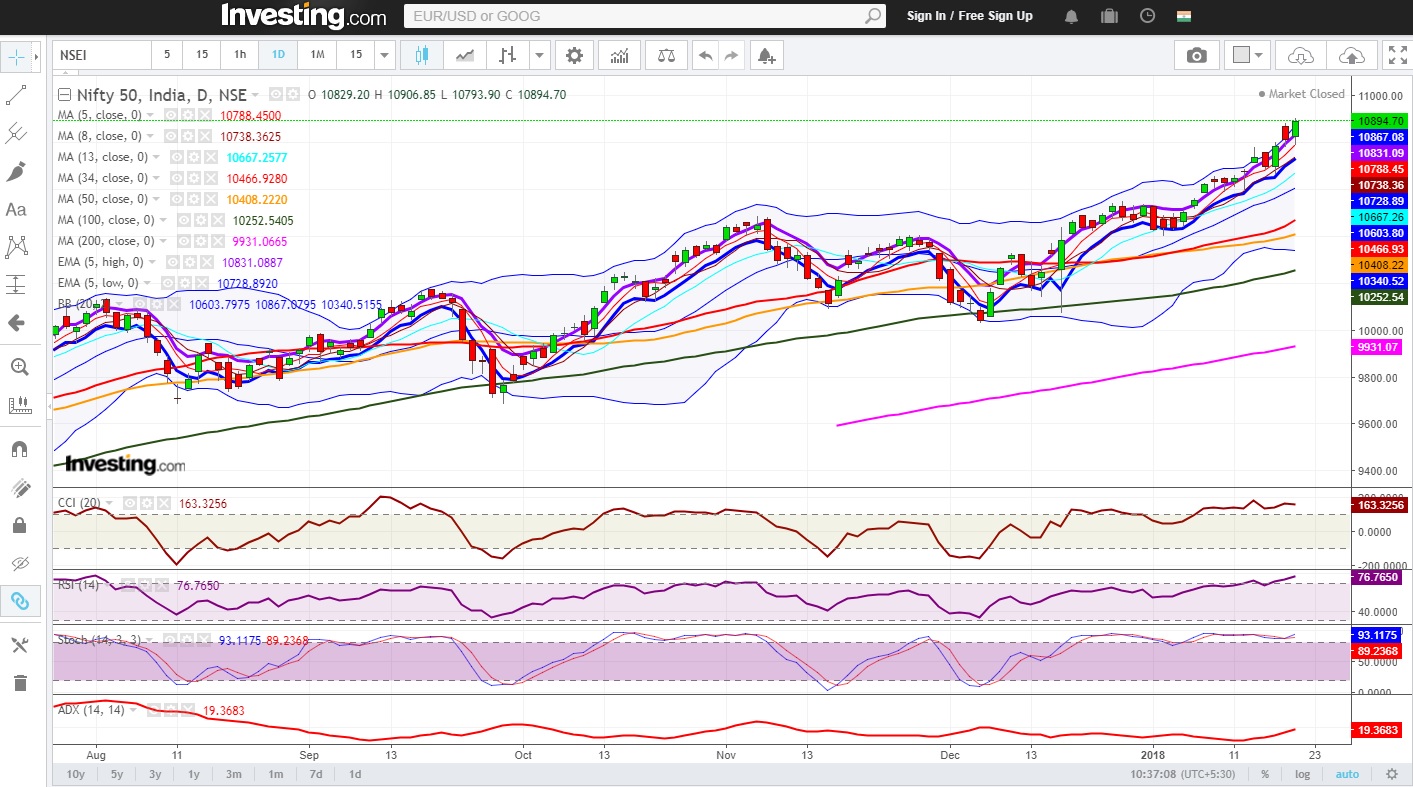
Nifty Daily Chart

Figure: Daily Chart

The daily CCI, RSI, Slow Stochastic are firmly in the over-bought region signaling a very bullish momentum. Even small dips are getting bought whenever the index is coming close to 5 day low EMA. The trademark of this week’s rally has been large-cap outperformance over mid-cap. This may continue for some more time. Technically speaking 5 day low EMA is very crucial level going forward. Any close below 5 day low EMA will be the first sign of the rally getting challenged.

Want to become a technical analysis expert? Enroll in: NSE Academy Certified Technical Analysis course on Elearnmarkets.

Join TMP Join TMP Join TMP

In the hourly chart, Nifty has been given a fresh breakout in last hour of Friday. The hourly CCI is in the overbought zone and the hourly slow stochastic and hourly RSI are on the verge of breaking into overbought zone. The hourly ADX is also bottoming out. Overall, possibilities of a very bullish week ahead are quite high, especially the first half of the week.

Nifty Hourly Chart

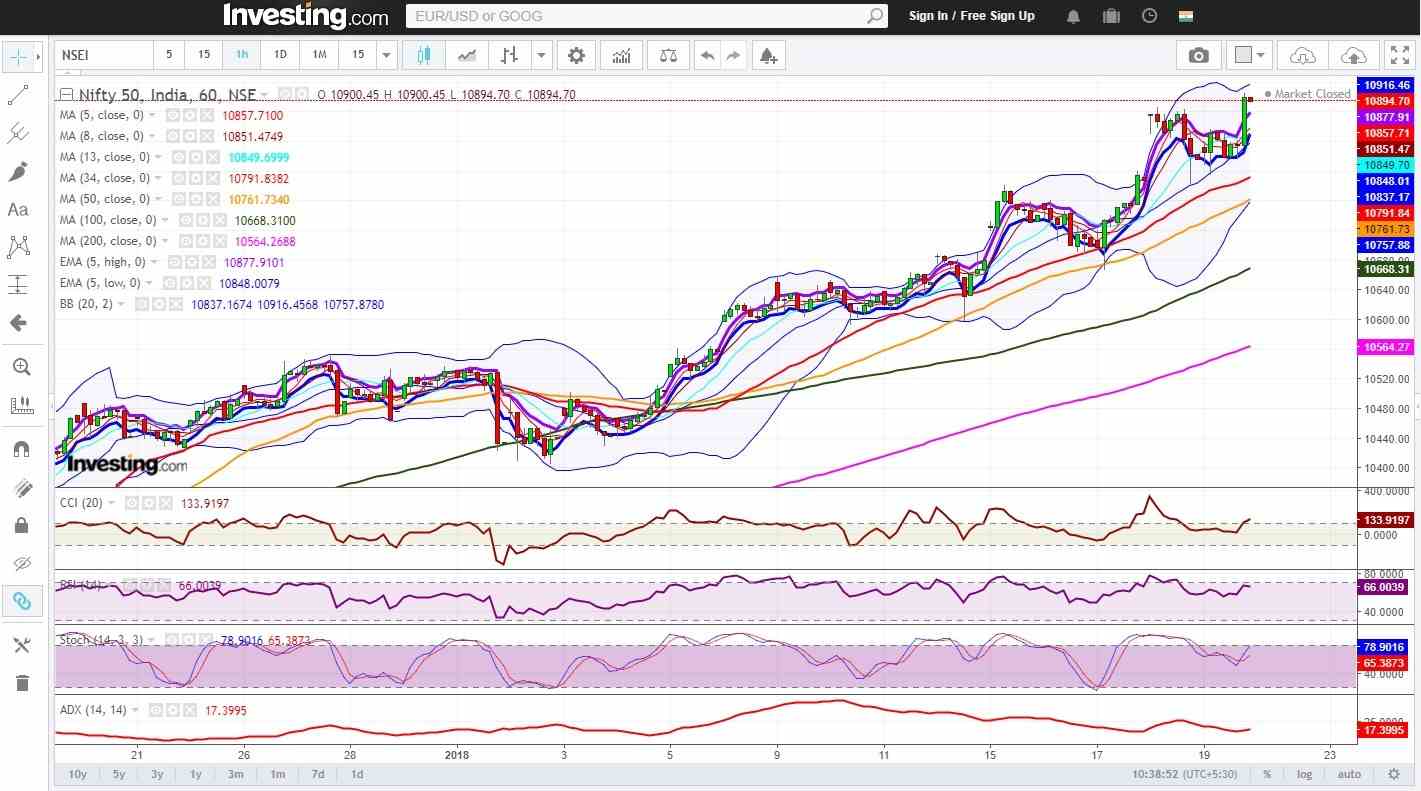
Figure: Hourly Chart

Webinar on Super Trending Multibagger Bank Nifty Option Strategy

Technical possibilities for upcoming week:

Nifty closed much above higher Bollinger band and 5 week High EMA in the weekly chart. This opens possibilities for further follow-up rally. However, we have to look for any loss of momentum in oscillators to identify early signs of reversal. A consistent close below 20 hour SMA will open possibilities for that kind of pause or reversal.

Nifty Weekly Chart

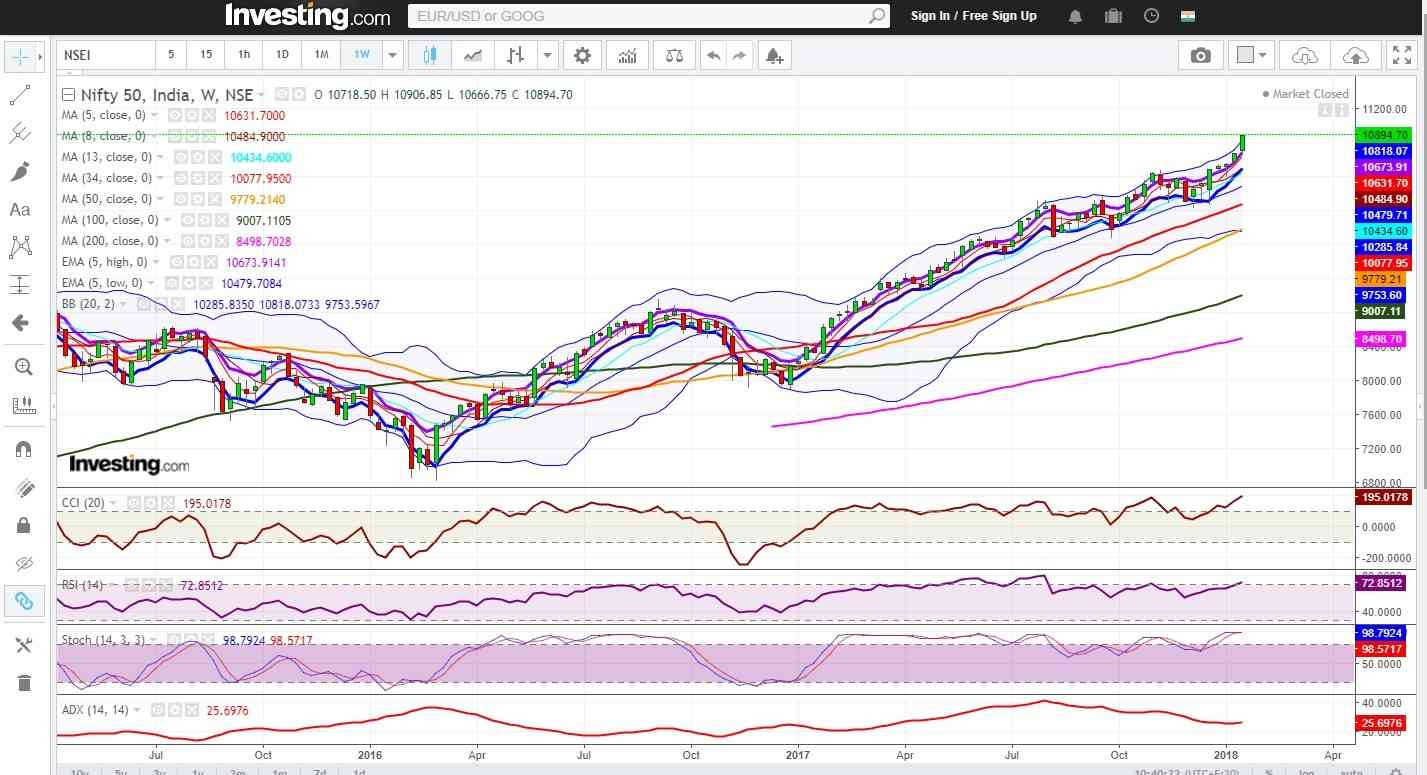
Figure: Weekly Chart

We are including the ELM level matrix for Nifty for Monday 22th January for your reference.

ELM Nifty matrix

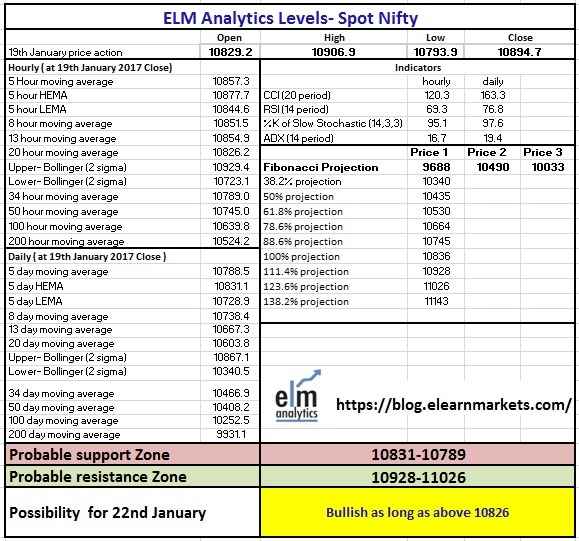
Figure: ELM Nifty Level Matrix 22 Jan

Watch the video below to know how the analyze the above matrix:

Tags: english
ShareTweetSend
Previous Post

Nifty Closes The Week At All Time High, Up-move Continues On Global Momentum

Next Post

Importance of in-depth analysis in Forex trading

Elearnmarkets

Elearnmarkets

Elearnmarkets (ELM) is a complete financial market portal where the market experts have taken the onus to spread financial education. ELM constantly experiments with new education methodologies and technologies to make financial education effective, affordable and accessible to all. You can connect with us on Twitter @elearnmarkets.

Related Posts

Hourly Chart
Market Analysis

Nifty Ends on Positive Note, Gains Approx. 475 Points on Positive Global Factors

November 18, 2020
378
Weekly Chart
Market Analysis

Huge Sell-Off Makes the Market Close in a Negative Note on the Expiry Week

November 18, 2020
175
Hourly Chart
Market Analysis

Nifty Ends in Green. Rupee Appreciates and Falling Crude Price Helped the Market to Recover Approx. 140 Point

November 18, 2020
129
Hourly Chart
Market Analysis

Sell Off Continues. Nifty Ends The Week With Three Consecutive Red Candles

November 18, 2020
141

Comments 2

  1. Pingback: Nifty Rises 2% For The Week, Bank And Tech Stocks Provide Leadership - IndianTaxHome
  2. frolep rotrem says:
    3 years ago

    I have been surfing online more than 3 hours lately, yet I never found any interesting article like yours. It is pretty worth sufficient for me. In my opinion, if all webmasters and bloggers made excellent content material as you probably did, the internet can be a lot more helpful than ever before.

    Reply

Leave a Reply Cancel reply

Your email address will not be published. Required fields are marked *

Follow Us

Facebook-f Twitter Instagram Linkedin-in Youtube Telegram

Register on Elearnmarkets

Continue your financial learning by creating your own account on Elearnmarkets.com

Register Free Account

Download App

Categories

  • Basic Finance
  • Derivatives
  • Financial Planning
  • Fundamental Analysis
  • Technical Analysis
  • Marketshala
  • Miscellaneous

Popular On Elearnmarkets

  • Market Superheroes:
  • Vivek Bajaj
  • Chetan Panchamia
  • Ashish Kyal
  • Premal Parekh
  • Abhijit Paul
  • Jegan
  • Sivakumar Jayachadran
  • Vishal Malkan
  • Jyoti Budhia
  • Vivek Gadodia
  • Vishal Mehta
  • Piyush Chaudhry
  • Santosh Pasi
  • Gomathi Shankar
  • Market Superheroes:
  • Vivek Bajaj
  • Chetan Panchamia
  • Ashish Kyal
  • Premal Parekh
  • Abhijit Paul
  • Jegan
  • Sivakumar Jayachadran
  • Vishal Malkan
  • Jyoti Budhia
  • Vivek Gadodia
  • Vishal Mehta
  • Piyush Chaudhry
  • Santosh Pasi
  • Gomathi Shankar
  • Courses:​
  • Options Trading
  • Dow Theory
  • Momentum Trading
  • Stock Investing
  • Stock Market for Beginners
  • Harmonic Chart Patterns
  • Algo Trading
  • Elliot Wave Theory
  • Advanced Excel
  • Cryptocurrency
  • NSE Certification Course
  • Courses:​
  • Options Trading
  • Dow Theory
  • Momentum Trading
  • Stock Investing
  • Stock Market for Beginners
  • Harmonic Chart Patterns
  • Algo Trading
  • Elliot Wave Theory
  • Advanced Excel
  • Cryptocurrency
  • NSE Certification Course
  • Webinars:
  • Bank Nifty Scalping
  • Intraday Trading Strategies
  • Options Trading Strategies
  • Options selling
  • Price Action
  • Relative Strength
  • Tax Planning
  • Options Buying
  • Growth Stocks
  • Portfolio Management
  • Relative Strength Index
  • Risk Management
  • Renko Charts
  • Crude Oil
  • Traders Psychology
  • Moving Average
  • Multibagger Stocks
  • Free Learning Modules:
  • Intraday Trading
  • Options Scalping
  • Swing Trading
  • Financial Modelling
  • RSI Indicator
  • Bollinger Bands
  • Pricing of Futures
  • Personal Finance
  • Initial Public Offerings (IPO)
  • Value Investing
  • Technical Indicators
  • Candlesticks
  • Chart Patterns
  • Option Greeks
  • ELSS Funds
  • Banking and Insurance
  • Real Estate
  • Gold
  • Book Summaries:
  • Rich Dad Poor Dad
  • Psychology of Money
  • The Intelligent Investor
  • The Richest Man in Babylon
  • Think and Trade Like a Champion
  • Value Investing and Behavioural Finance
  • Trading in the Zone
  • Learn to Earn
  • Book Summaries:
  • Rich Dad Poor Dad
  • Psychology of Money
  • The Intelligent Investor
  • The Richest Man in Babylon
  • Think and Trade Like a Champion
  • Value Investing and Behavioural Finance
  • Trading in the Zone
  • Learn to Earn
  • Tools:
  • CAGR Calculator
  • SIP Calculator
  • eLearnOptions
  • Future Value Calculator
  • Present Value Calculator
  • Atal Pension Yojana
  • Cost of Delay Calculator
  • Become a Crorepati
  • Tools:
  • CAGR Calculator
  • SIP Calculator
  • eLearnOptions
  • Future Value Calculator
  • Present Value Calculator
  • Atal Pension Yojana
  • Cost of Delay Calculator
  • Become a Crorepati

© 2023 Elearnmarkets. All Rights Reserved

  • Visit Elearnmarkets
  • Courses
  • Webinars
  • Financial Guides
  • Get Free Counselling
  • Visit Elearnmarkets
  • Courses
  • Webinars
  • Financial Guides
  • Get Free Counselling

Get Elearnmarkets App

No Result
View All Result
  • Article Categories
    • Basic Finance
    • Derivatives
    • Financial Planning
    • Fundamental Analysis
    • Technical Analysis
    • Marketshala
    • Miscellaneous
  • Language
    • Hindi
    • Bengali
    • English
  • Courses
  • Webinars

© 2020 Elearnmarkets All Rights Reserved

Suggested Learning

Technical Analysis Made Easy

Certification in Online Technical Analysis

Online NSE Academy Certified Capital Market Professional (E-NCCMP)