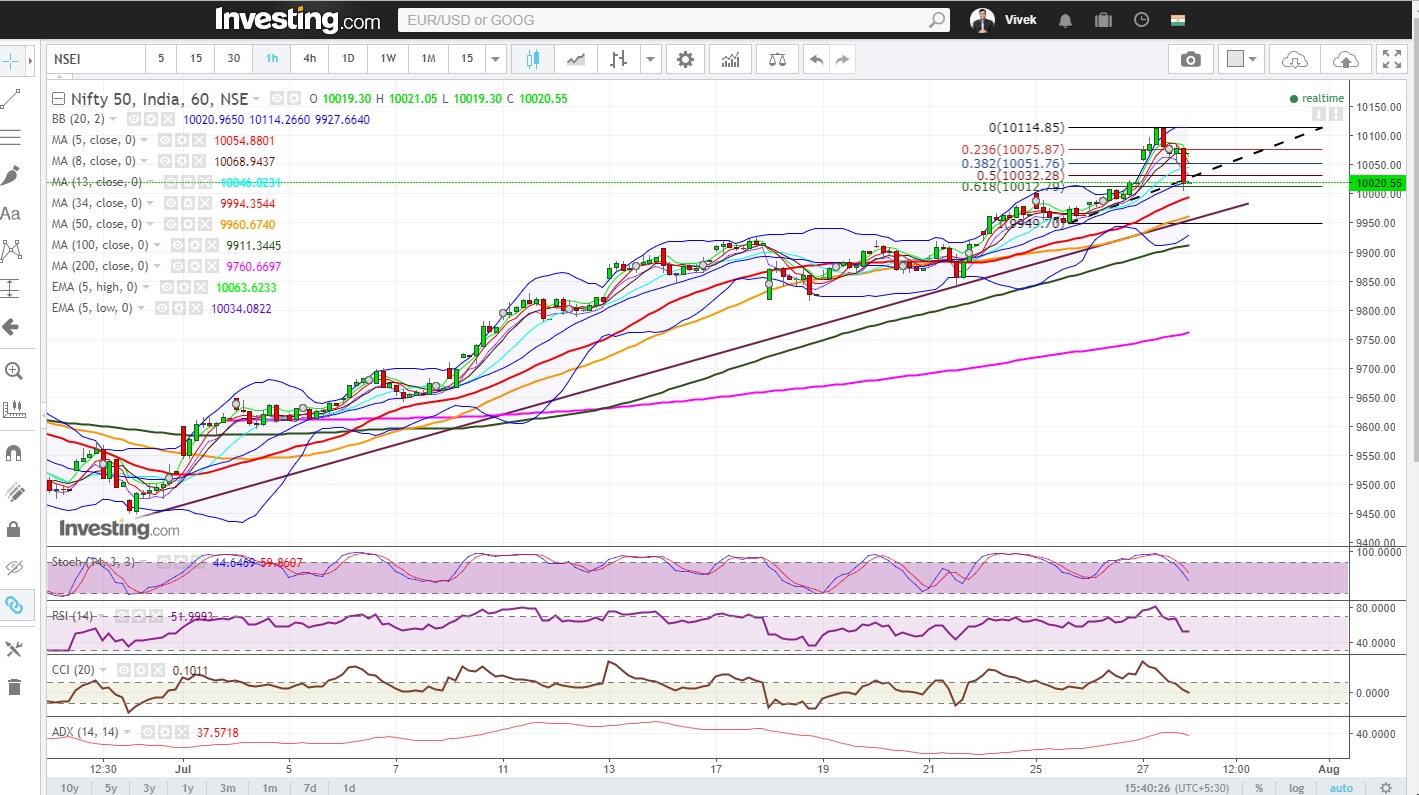
Nifty (Close approx. 10020.55) Nifty opened gap up today post US FED interest rate decision and domestic news flow. 10000 strike call writers were forced to square off their positions. This pushed the Nifty even higher to 10114.85. From there, Nifty started correcting and made of low of 10005.5. Finally Nifty expired at 10020.55.
Hourly technical: In hourly chart Nifty has corrected sharply and closed at 10020.55 near hourly mid Bollinger line, which stands at 10021, on Thursday’s close. In near term Nifty may find support close to 34 hour moving average (presently at 9994) and 50 hour moving average (presently at 9960.7). The selloff in Nifty could be just an one day phenomenon due to profit booking by bulls ahead of expiry. If Nifty has to resume the uptrend it should bounce back from 34 hour moving average or 50 hour moving average (close to the trend line indicated in hourly chart). On the other hand for a deeper correction to begin, Nifty should move below the trend line.
The Fibonacci retracement of the last rise from approx. 9949.7 to approx. 10114.9 is drawn in the hourly chart and today’s close is near the 61.8% retracement level of approx. 10013.
On the upside today’s high of approx. 10115 should act as a logical resistance .
The hourly CCI, RSI, slow stochastic have entered into respective normal zones from overbought zones. The hourly ADX has just started trending downwards. Overall these point to a neutral possibility for Nifty in very near term.
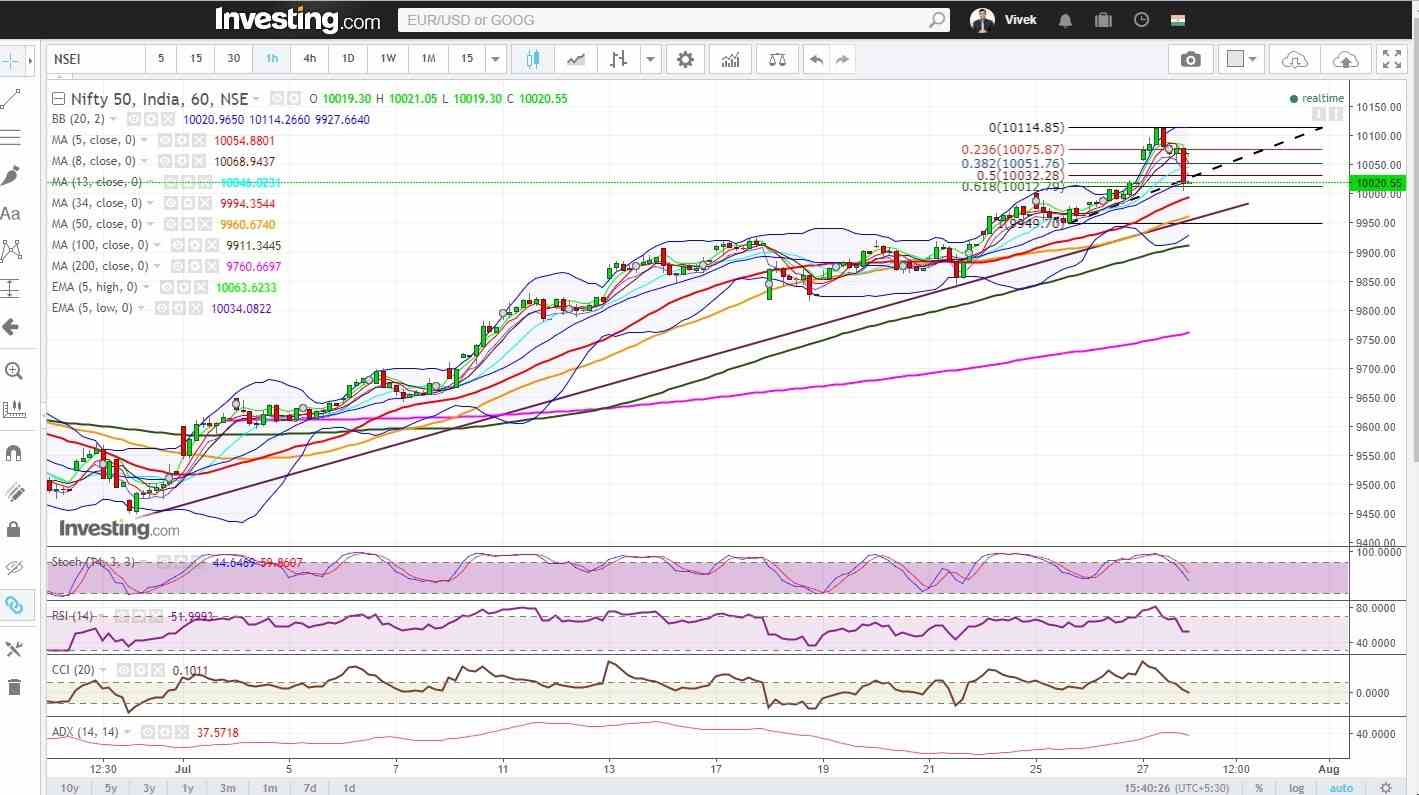
Figure: Hourly chart
Daily technical: Nifty corrected after gap up opening for the day. The Nifty closed just below the 5 day high EMA. But, we do not read a lot into this as today was July series expiry and price actions are often day specific on expiry days.
On the downside, 5 DMA, 8 DMA and 13 DMA , which are presently placed at approx. 9977, 9936 and 9906 respectively should act as probable supports. The fact that Nifty corrected from the up trending resistance line, can be reason for caution in immediate future. Nifty may easily choose to correct 200-300 points to 20 or 34 DMA in the down-side, without affecting its ongoing 7 month old uptrend. The overall up-trend is intact as long as Nifty keeps on defending 50 DMA on the down side. Such a possibility can only materialize if nifty start closing below 5 DMA.
The daily CCI, RSI and slow stochastic are in overbought zones, which indicate bullish sentiment in the daily time frame. On the upside, the upper Bollinger band in daily time frame (presently at 10101.2) should act as logical resistance level.
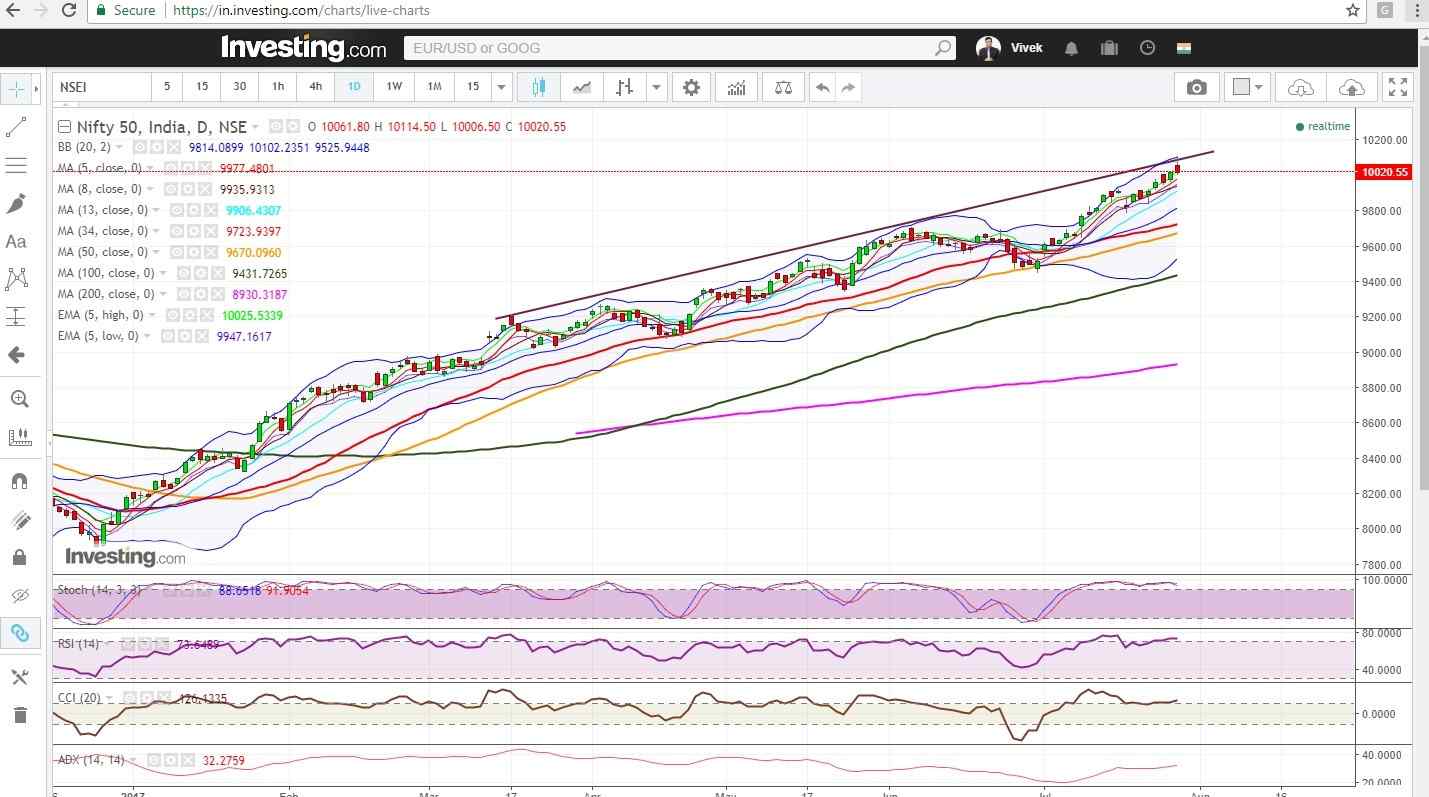
Figure: Daily chart
On the upside, multiple daily closes above 10036 (approx. 100% projection of Nifty up move from approx. 6826 to 8969, from December 2016 low of approx 7894) should open up Nifty for upside move towards Fibonacci projection levels (approx. 10542, 10855, 11108 etc.) as indicated in the below chart.
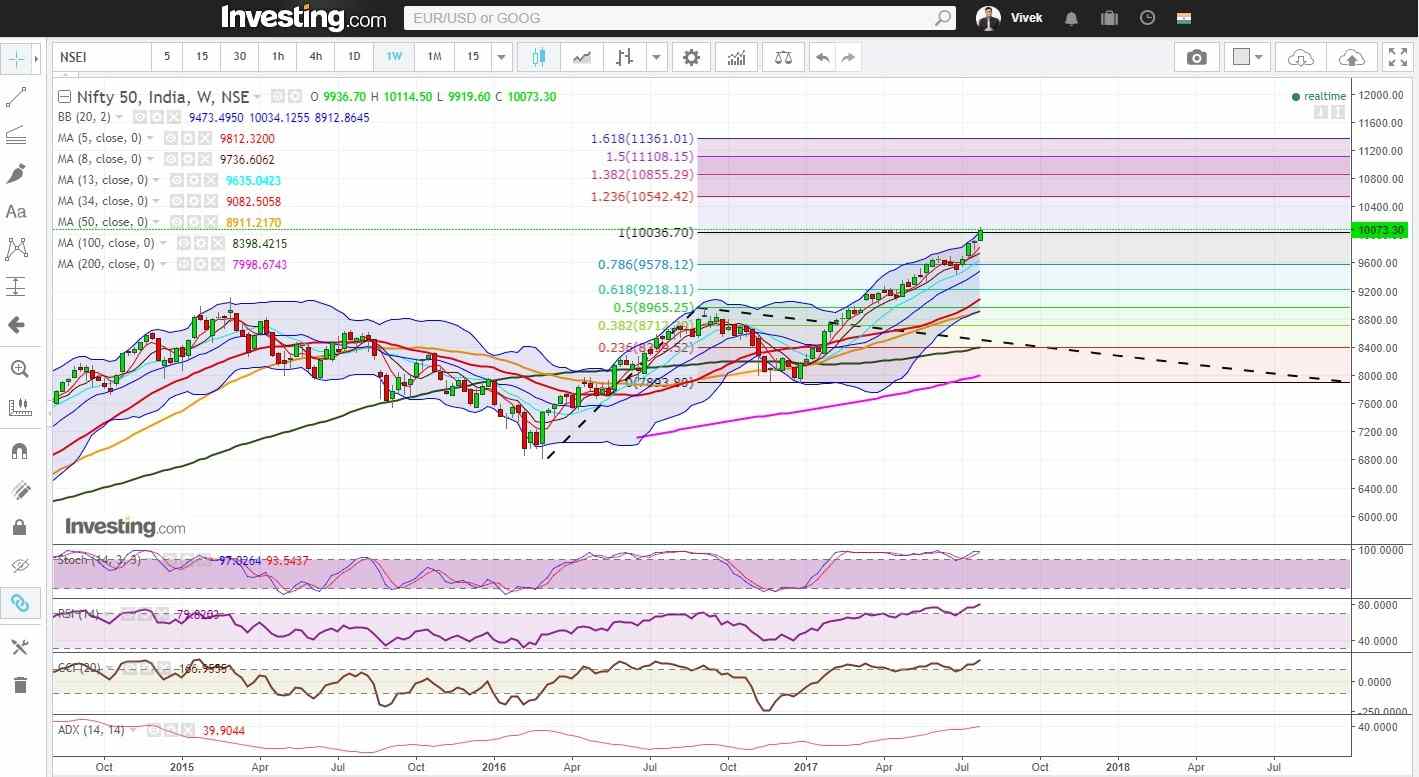
Figure: Weekly chart
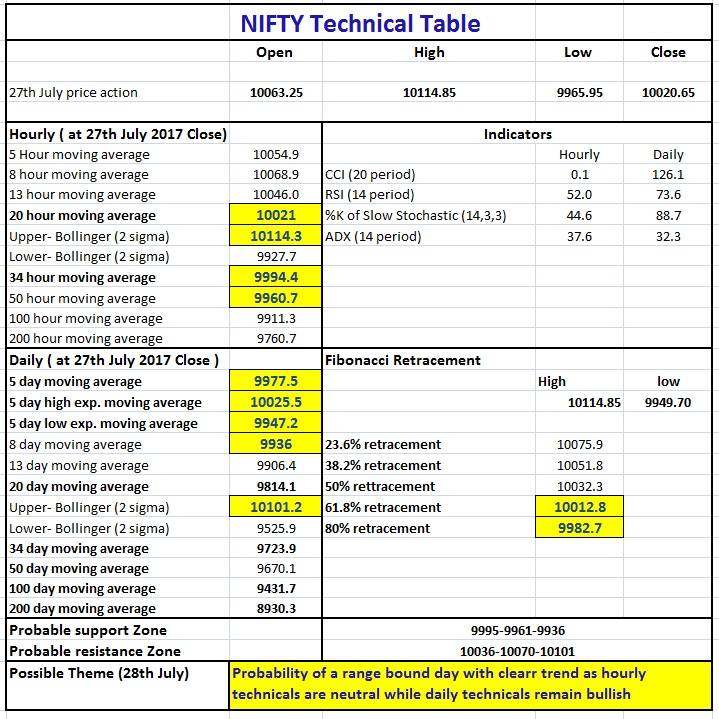
Figure: Tech table


