Nifty close 11675.65: Despite Rupee trading in a life time low level Nifty continues making higher highs and higher lows. Just like the previous week this week also Nifty closes by making a Doji in the daily chart. But beginning of this week was great. A Solid bullish candle showed us the confidence of the Bulls. However last three candles in daily chart simultaneously shows the correction is also taking place.
Indicators are in the overbought level but until the momentum and the strength are supporting the index, more upside is possible.
At this point Nifty likely to face resistance at 11820 level and for support it would be 11450.
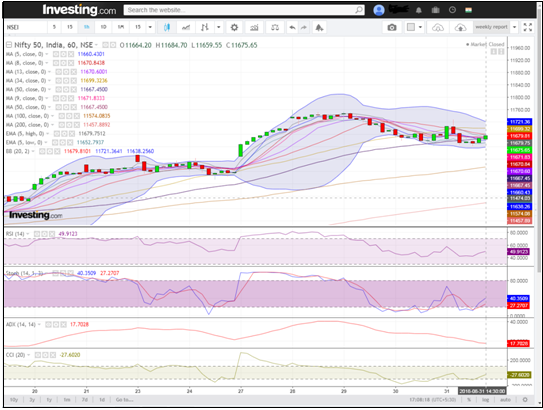
Hourly Technical:Hourly chart the index is consolidating little bit and most of the moving averages are in the place of contraction. If the index closes above 11700 level,then another rally may be witnessed.
Most of the indicators in the hourly chart is in a neutral position. RSI is below 50, Stochastic is in the 40 zone, ADX is below 20 and slopping down and CCI is at below 0.
Overall there is a chance of Consolidation as well as a up move but no such sign of downfall. In case of down fall there two major supports which are Lower Bollinger band (presently at approx. 11638.25) and the 100MAline(presently at approx. 11574.08).
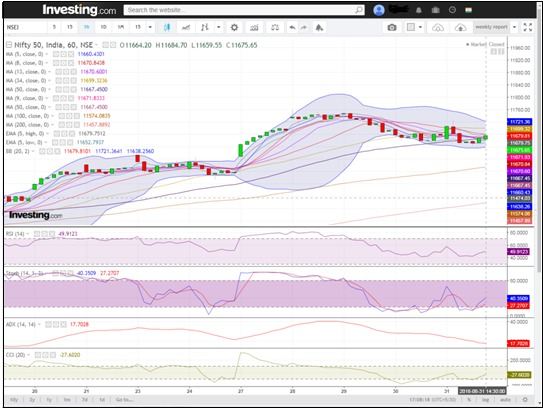
(Hourly chart)
Daily Technical: As we mentioned earlier Nifty closed this week by making a Doji in the daily chart and presently it is trading at a support level which is at 11648 level. In case Nifty breaches 11641.15 level there is another support at 11550 level.
Let’s discuss the indicators, In the daily chart Indicators are in the overbought level. RSI is above 65, Stochastic is at above 79, ADX is above 40 and CCI is above 100.
So overall further upside is more possible than any down fall. The rally likely to continue again when the index closes above 11726.65.
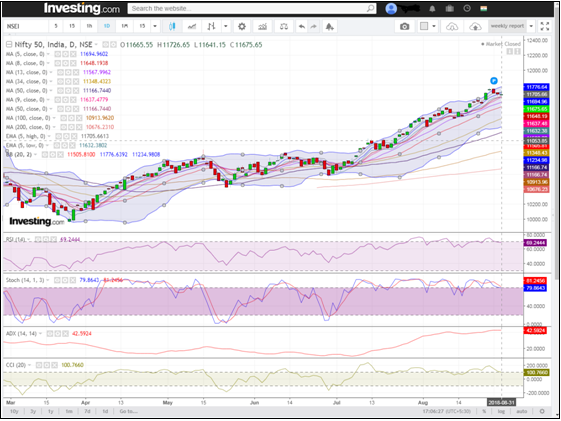
(Daily chart)
Weekly Technical: In the weekly chart we can see that the candle size is getting smaller and smaller as the index heading up but there is no red candle in the latest rally. So in the weekly chart Nifty is very bullish.
Most of the Moving averages line are below the price so in case of short fall there will be huge support from 11450, 11350 and 11130 level. For resistance 11800 and 11850 level may react.
Lets discuss the indicators, RSI is above 70, Stochastic is above 90, ADX is above 20 and the CCI is above 150.
In short there is no such sign of downfall but a minor correction may take place but in long term The index is bullish.
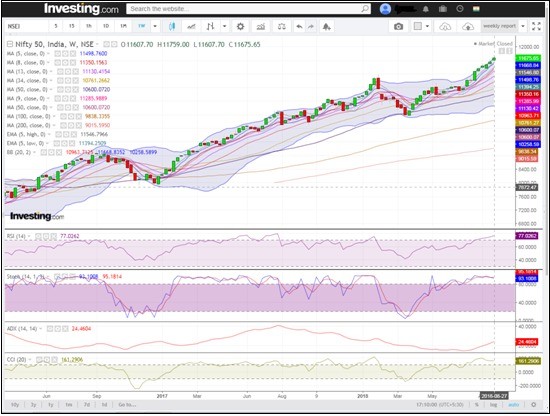
(Weekly chart)
You can use stockedge app to get cutting edge over others in both short term trading and investing. Here you not only get data at one particular place but can also create your own combination scans based on your own technical and fundamental parameter. See the video below to know about various features in Stockedge app.
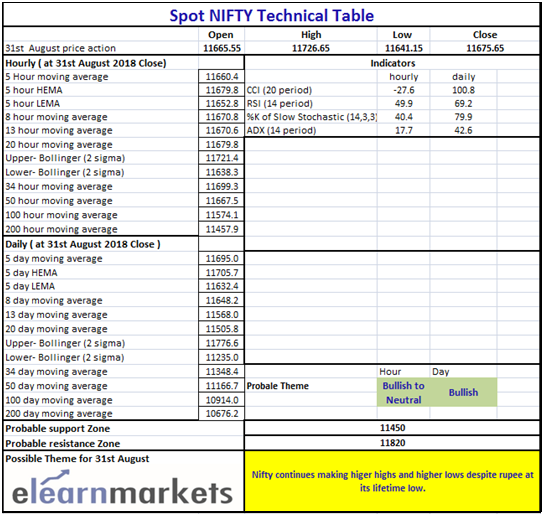
(Technical Table)


