Nifty (Close 9912.8): Nifty opened gap up in today’s session but saw some profit booking from an important resistance of mid Bollinger line or 20 DMA (presently at approx. 9920.9) as mentioned in last day’s report.
Hourly Technical:
Nifty is standing at a make or break juncture. Today it made a high of 9925.75, however it couldn’t breach the important resistance of 200 hourly moving average (presently at approx. 9933.4) which acted as a strong resistance in the last attempt.
On the upside, Nifty may face resistance at 200 Hourly moving average (presently at approx. 9933.4), 61.8% retracement (presently at approx. 9965.8) and 78.6% retracement (presently at approx. 10041.5) of the down move from approx. 10137.9 to approx. 9687.5.
Become a technical analysis expert by enrolling in NSE Academy Certified Technical Analysis course on Elearnmarkets.
The probable support in the hourly chart comes at 13 Hour moving average (presently at approx. 9890.1) and 20 Hour moving average (presently at approx. 9873.1).
Hourly Stochastic, RSI and CCI are close to the upper bound of the respective normal zone.
However, Hourly ADX is steadily moving up which suggests that market may continue to some momentum in the coming days. Overall Nifty remains bullish in the hourly chart.
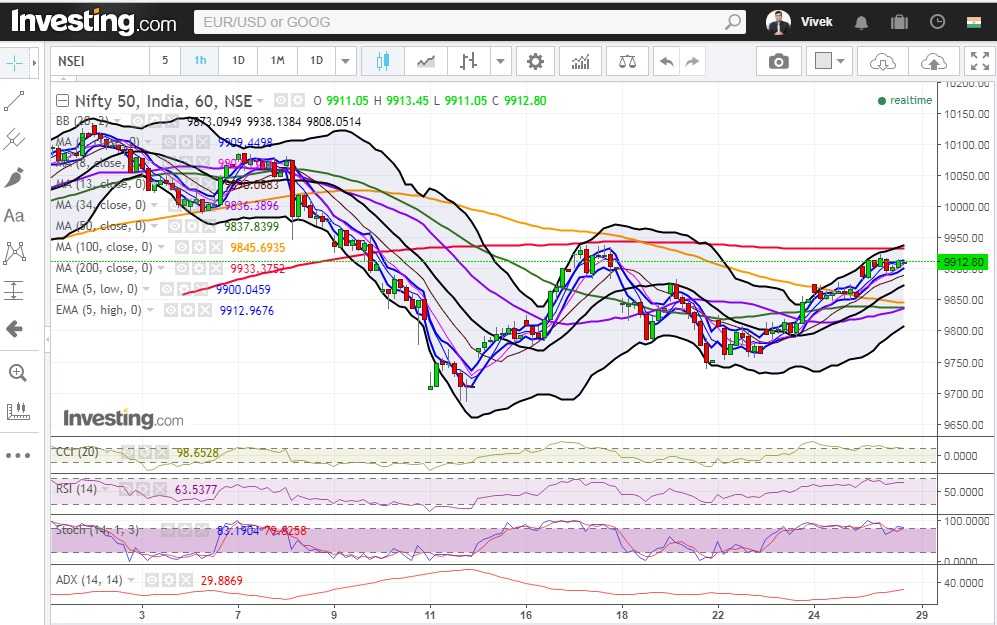
Figure: Hourly Chart
Daily Technical:
In the daily chart, Nifty has closed above 5 Day high EMA which is positive in the short to intermediate term.
Today market faced a strong resistance at 20 DMA line (presently at approx. 9920.9).
It is really important for Nifty to breach this resistance if it wants to continue its upward journey.
It may see some bit of a consolidation here for the coming few days.
On the downside, the probable support could be seen at 5 DMA (presently at approx. 9828.4).
On the upside, 20 DMA (presently at approx. 9920.9) may act as a potential resistance.
The daily RSI, CCI and stochastic are in the neutral zone.
However, the declining ADX indicates lack of downside momentum. Overall Nifty remains neutral in the Daily chart.
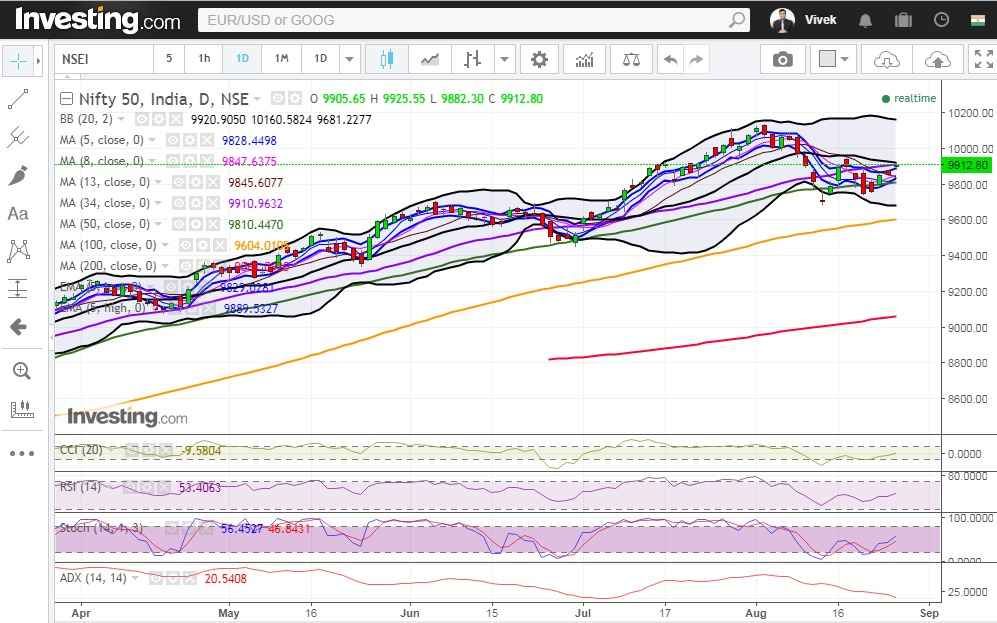
Figure: Daily Chart
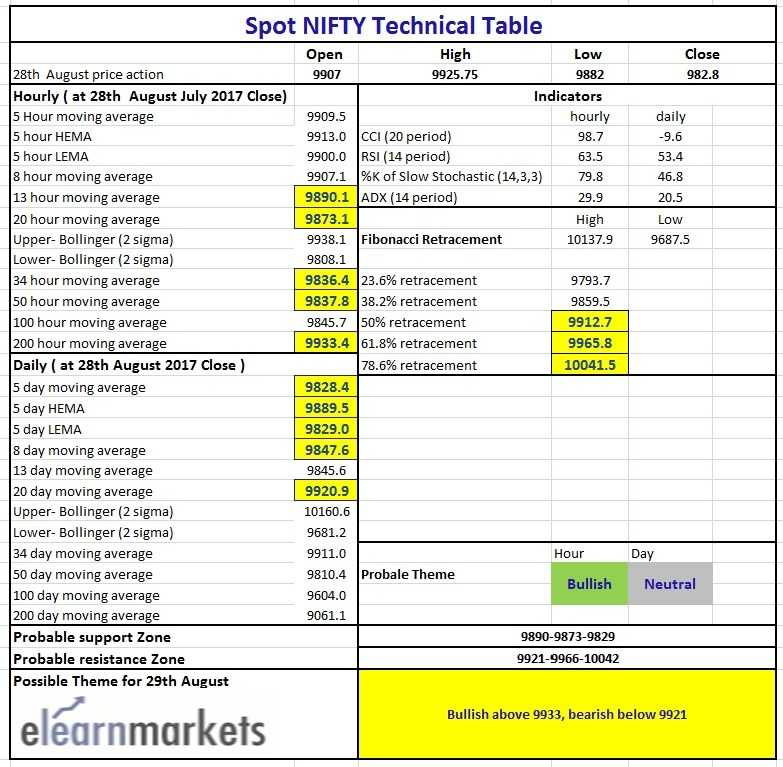
Figure: Nifty Tech Table
Watch the video below to effectively utilize the above table :


