Nifty (Close 9857.1):
Nifty traded in a very tight range and closed below 5 Day High EMA (presently at approx. 9870.7).
In the near term, Nifty may face a strong resistance at 200 Hourly moving average (presently at approx. 9932.5), which acted as a strong resistance in the last attempt.
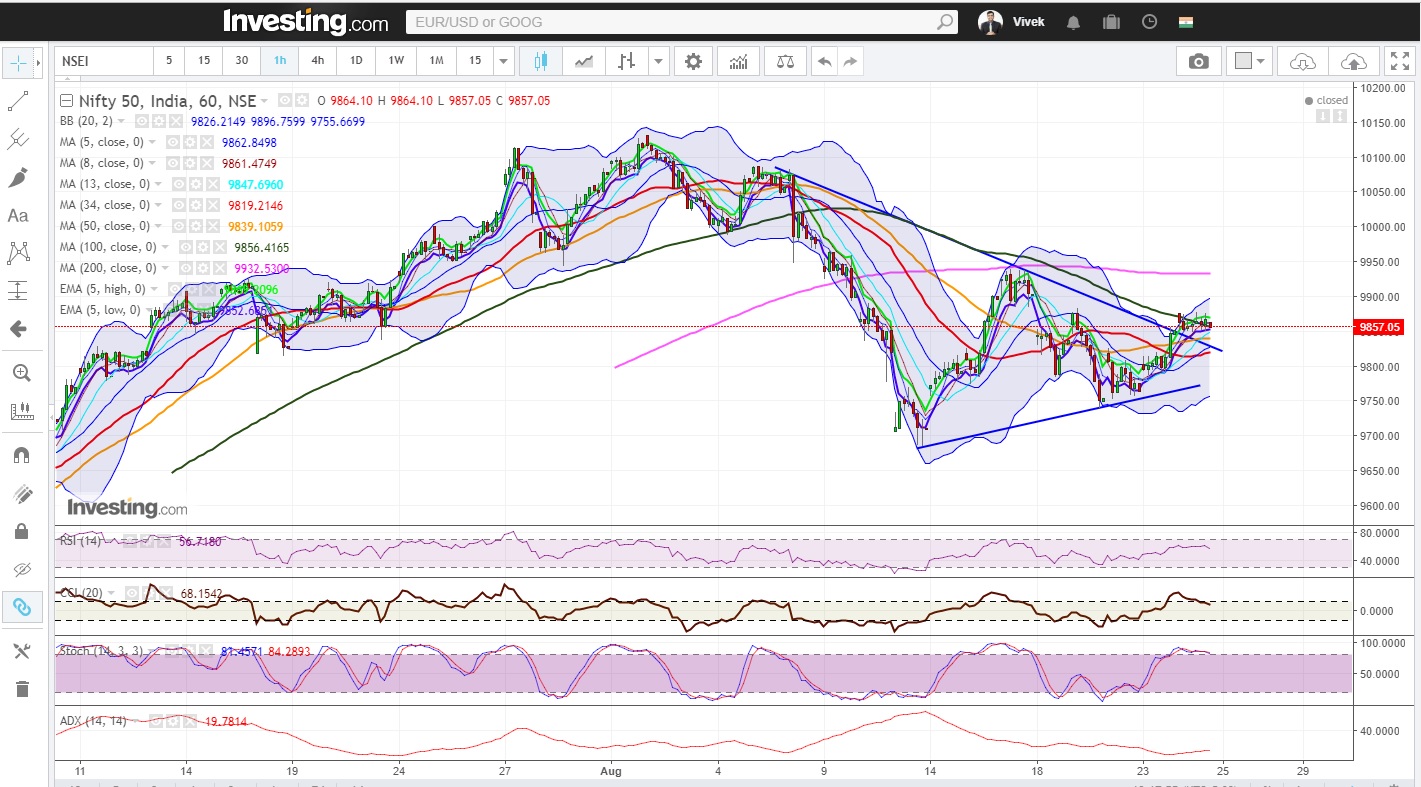
Hourly Technical:
Nifty consolidated at the edge of the symmetrical triangle.
The coming week would be very important for Nifty, which would decide the direction of the market going forward.
The probable support in the hourly chart comes at 13 Hour moving average (presently at approx.9847.7).
On the upside, Nifty may face resistance at 200 Hourly moving average (presently at approx. 9932.5).
Hourly Stochastic and CCI are close to the upper bound of the respective normal zone while RSI is still in the neutral zone. However, Hourly ADX has turned up which suggests that market may see some momentum in the coming week.
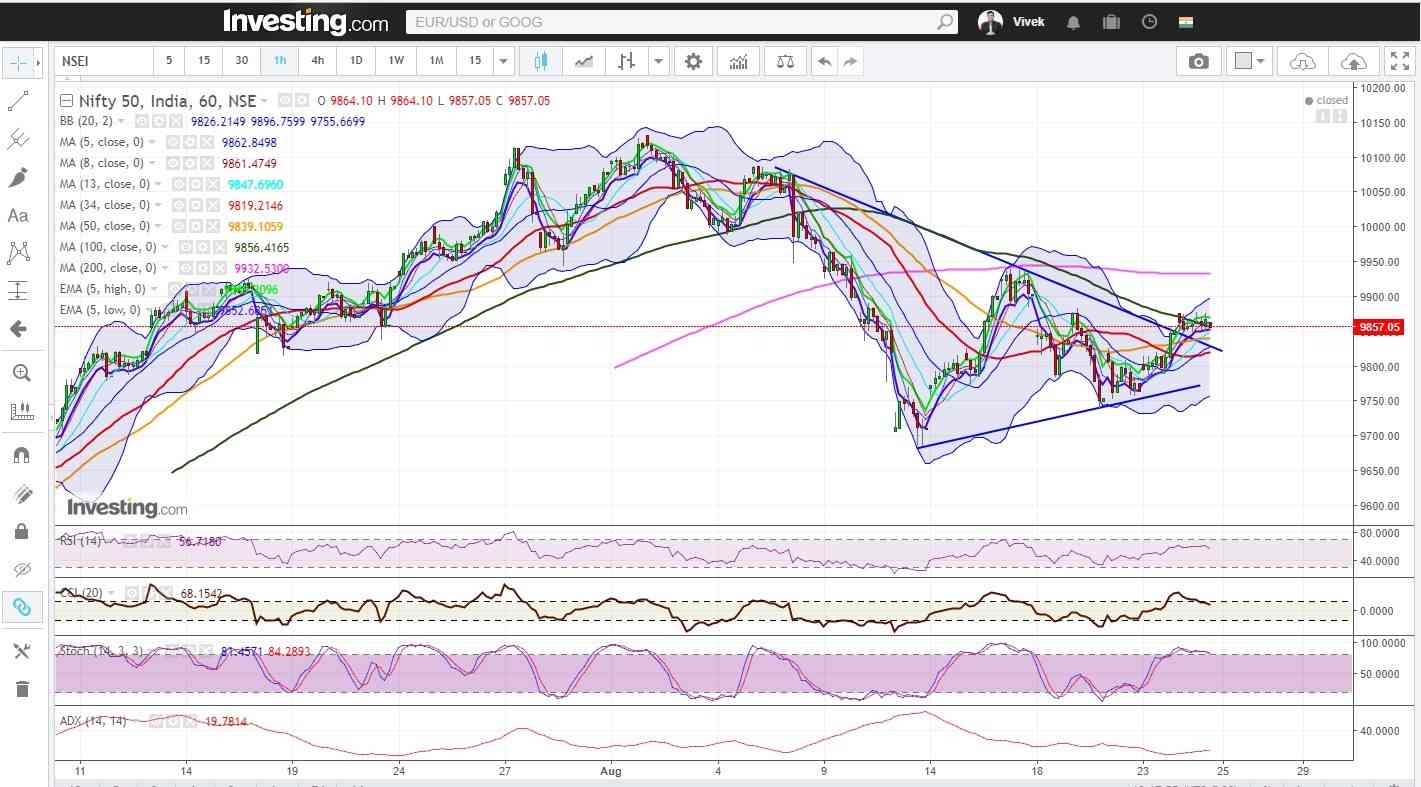
Figure: Hourly Chart
Daily Technical:
Nifty has closed below 5 Day High EMA (presently at approx. 9870.7) and it may face strong resistance at the mid-Bollinger line (presently at approx. 9926.3) in the daily chart.
On the downside, the probable support could be seen at 8 DMA (presently at approx.9832.8) and 5 Day Low EMA (presently at approx.9802.6). On the upside, 34 DMA (presently at approx.9903.7) may act as a potential resistance.
The daily RSI, CCI and stochastic are in the neutral zone.
Know more about Technical Analysis by joining: NSE Academy Certified Technical Analysis course.
However, the declining ADX indicates lack of downside momentum.
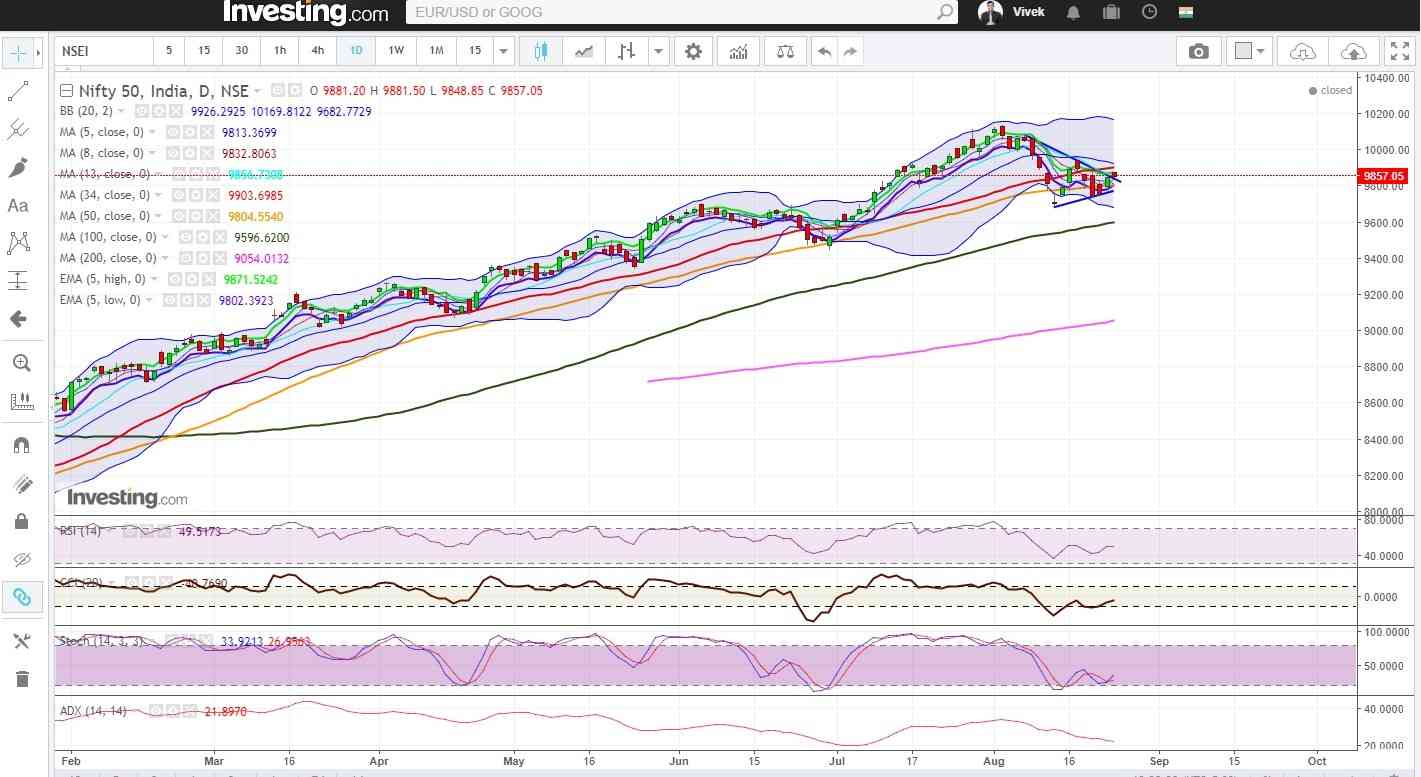
Figure: Daily Chart
Weekly Technical:
In the weekly chart, the overall bearish view due to the presence of long red candle last week is partially negated.
The Nifty has closed above 5 week low EMA (presently at approx. 9757) for the second consecutive week and market taking support from that level is a sign of strength in the weekly chart.
Weekly CCI, RSI, slow stochastic are in the normal zone while weekly ADX looks like topping out.
Overall, Nifty remains neutral to bullish in the weekly timeframe.
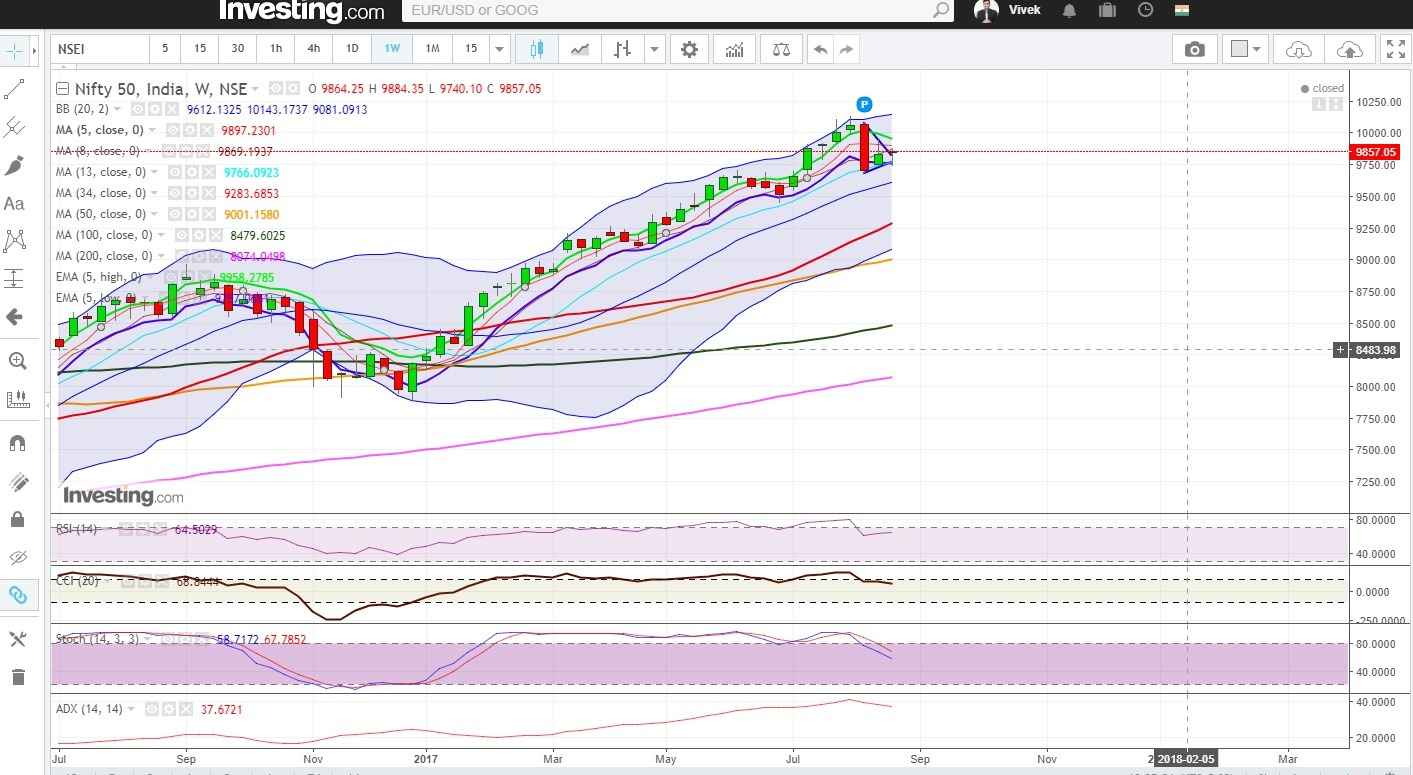
Figure: Weekly Chart
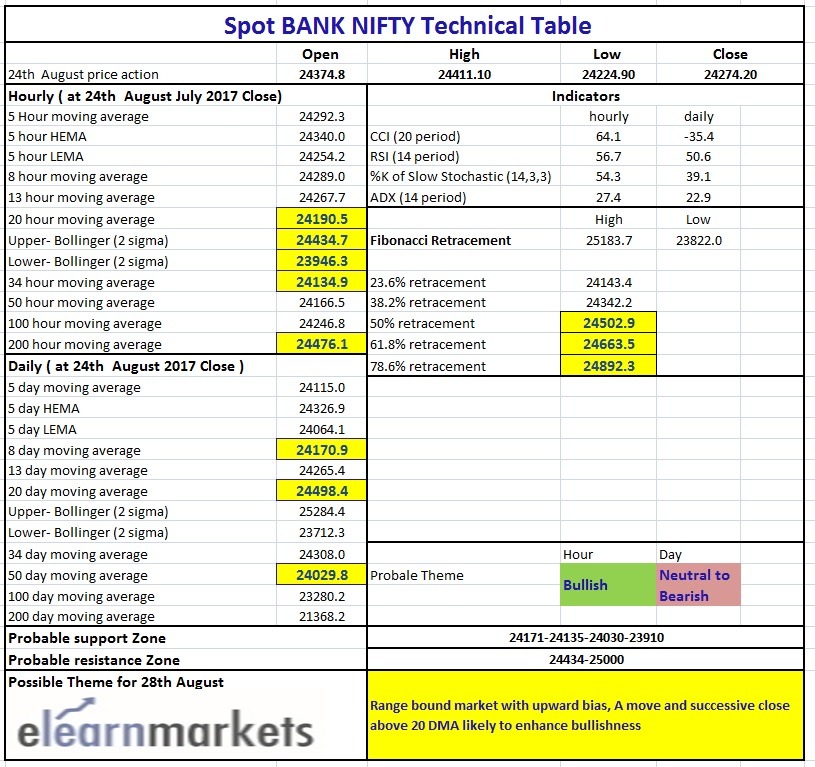
Figure: Tech Chart
You can watch the video below to know how to interpret the above table:
Bank Nifty
Bank Nifty opened gap up on Monday the 21st of August. Thereafter the Index recovered sharply from its weekly low and closed below the 5 Week High EMA of (24564 approx).
Hourly Technicals:
In the Hourly Chart, Bank Nifty has closed at 24724 which is marginally below its 5 Hour Moving Average of 24292. This, however, does not indicate that the Bears have the upper hand yet as the Index has successfully maintained above 5 Hour EMA of its low of (24254 approx). The Index is likely to face immediate resistance around 5 Hour EMA (24340 approx) areas. Bank Nifty has to close convincingly above 200 Hourly MA (24476 approx) before the scales turn in favor of the Bulls.
Hourly RSI and CCI are gradually inching towards the higher end of their normal range. The hourly ADX too is indicating that Bank Nifty is gradually picking up momentum.
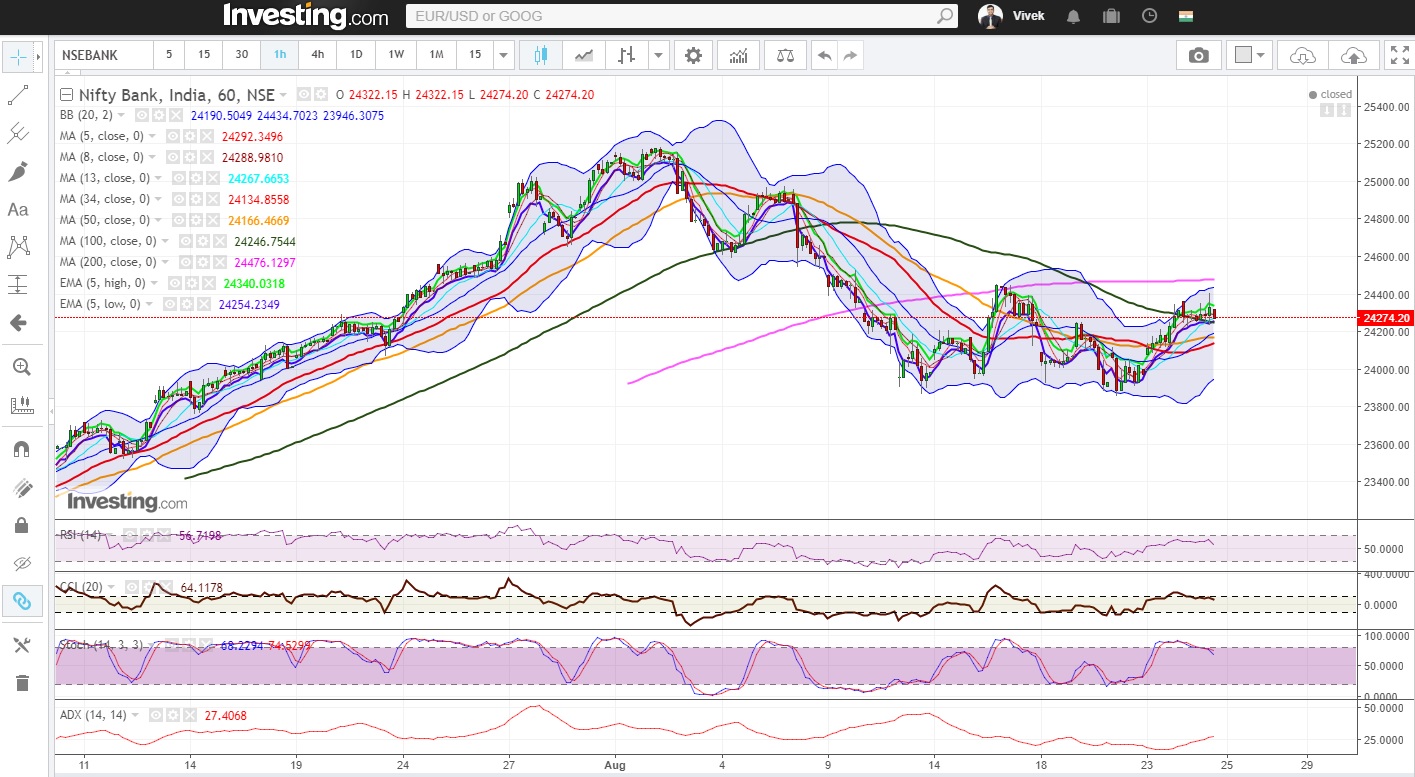
Figure: Bank-Nifty Hourly Chart
Daily Technicals:
A quick look at the daily chart indicates that Bank Nifty has closed marginally below the 34 DMA of (24308 approx).
If the Index breaks above the 24480 mark, the next target will be the upper band of Bollinger which is 25284. On the downside, however, if Bank Nifty breaks and closes below 23822, it could drag the Bulls down to 23060 levels.
Daily RSI and CCI indicators, however, suggest that Bank Nifty will trade in a range. ‘
The ADX too has remained towards the bottom.
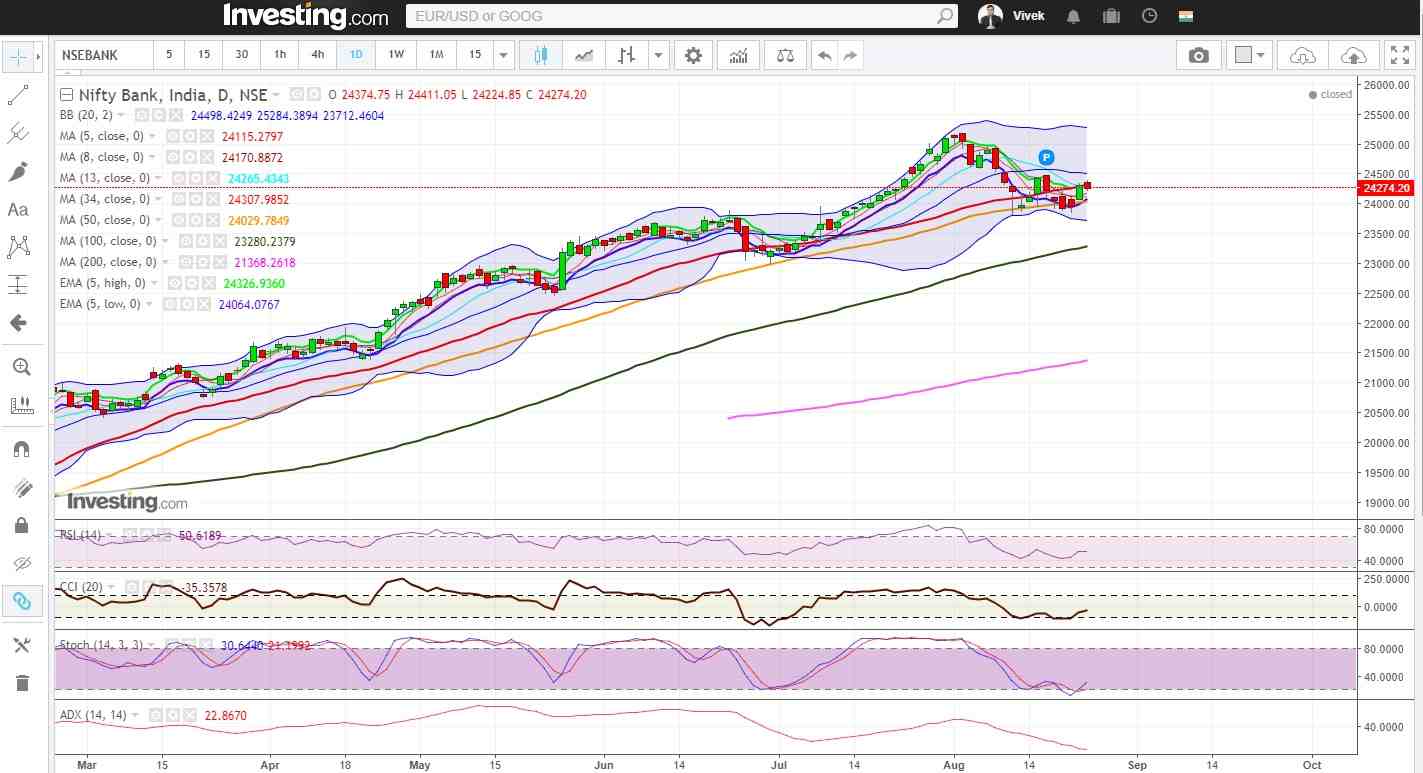
Figure: Bank-Nifty Daily Chart
Weekly Technicals:
The weekly chart shows that Bank Nifty has bounced back from its two week low of 23822. If Bank Nifty closes above 5 Weekly High EMA (24565 approx) in the coming week, it will propel the index to the next target of 25173 (Upper Bollinger) approx. Bank Nifty has taken the support of the 5 weeks Low EMA (23906 approx).
Weekly RSI and CCI, however, is closer to the higher end of the normal range. ADX too is indicating that a major move is on the cards.
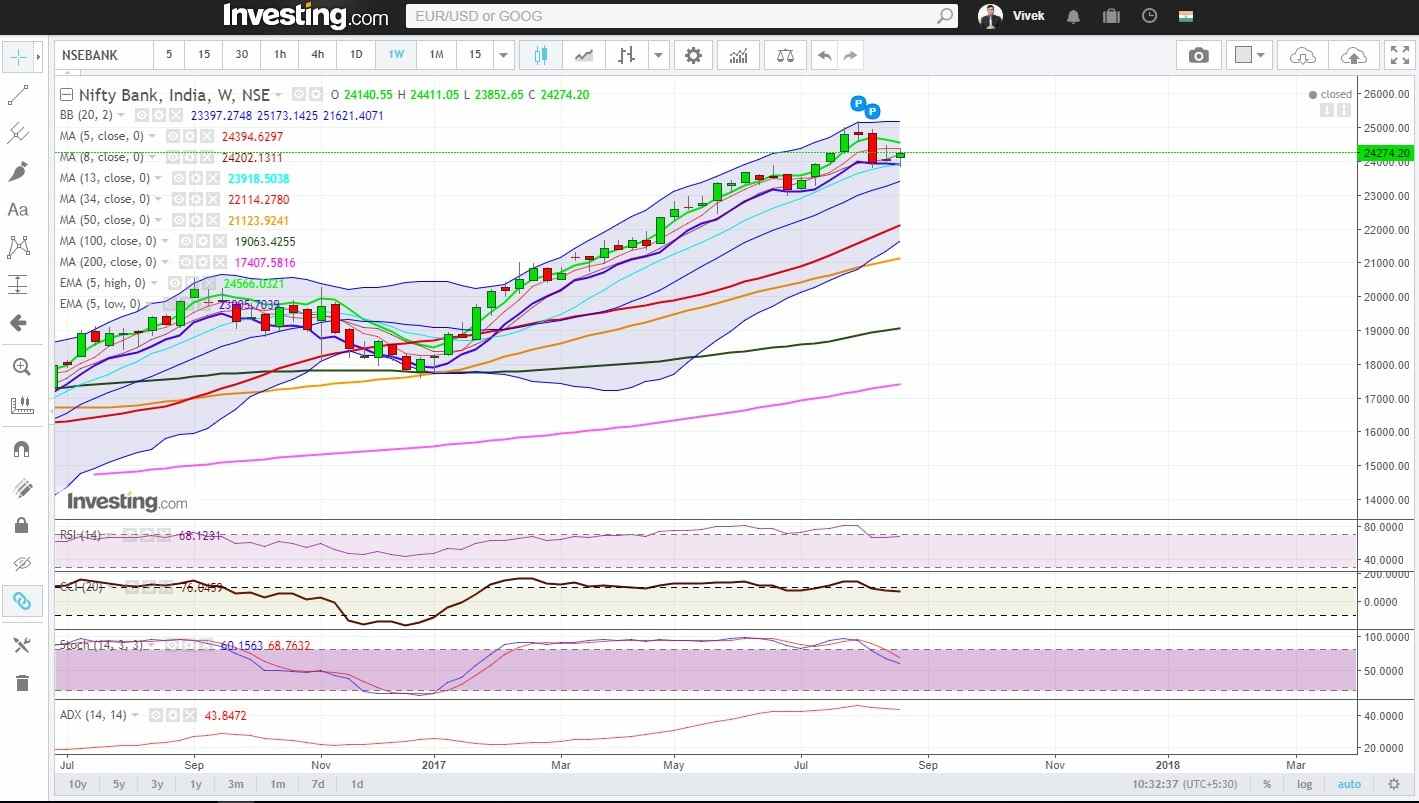
Figure: Bank-Nifty Weekly Chart
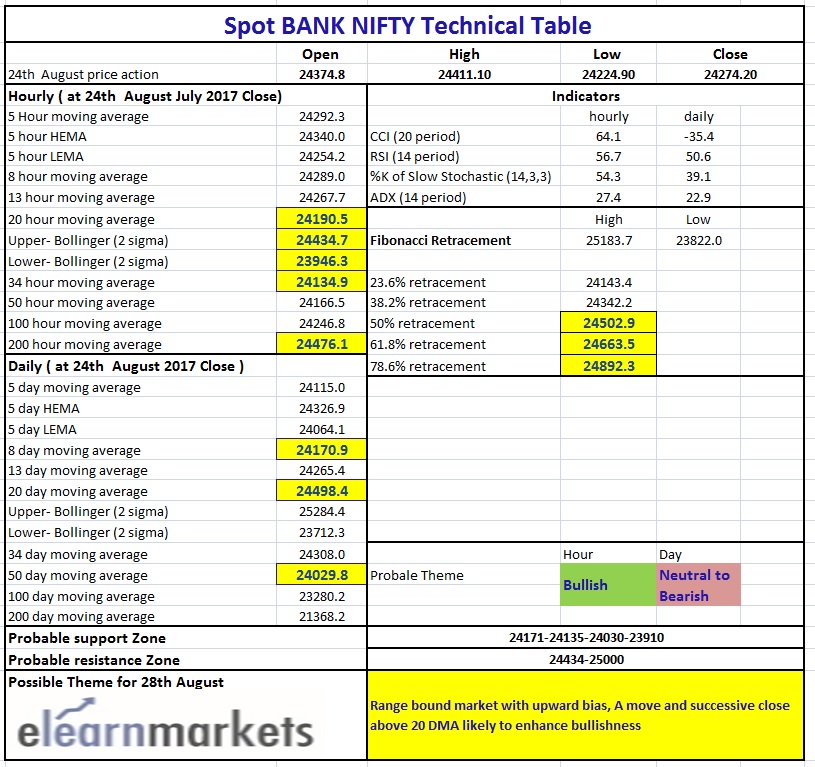
Figure: Bank-Nifty Tech Chart


