Nifty (Close approx. 9820.3): Market fell for the fourth consecutive session on Thursday with a gap down.
After yesterday’s close below 200 hourly Moving average (presently at approx. 9926.4), the market today breached another important support of 34 DMA (presently at approx. 9838.1).
However, the market bounced in the last one hour from the vicinity of 50 DMA support (at approx. 9770).
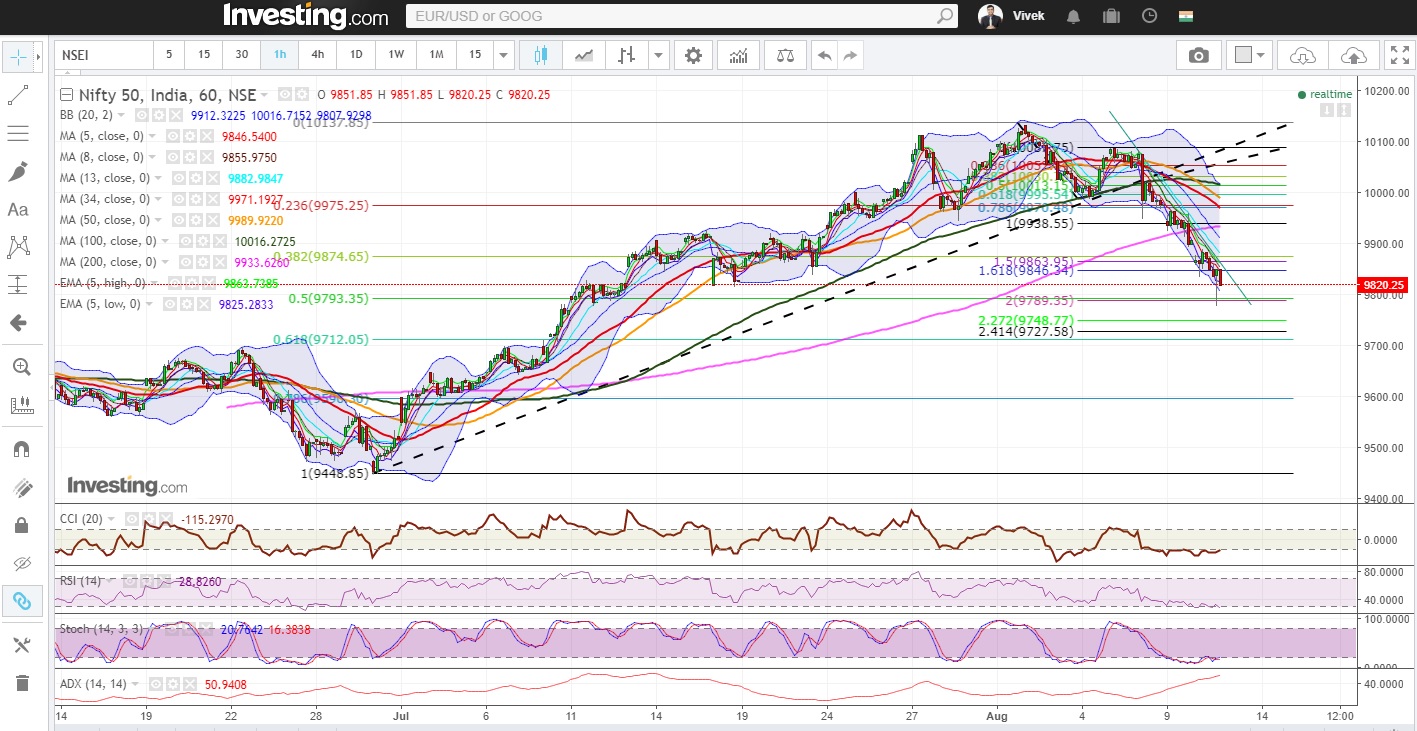
Hourly Technical:
In today’s trade, Nifty was down by 87.80 points.
At present the market is below most short-term moving averages and the next probable support in the hourly chart comes at 50% retracement (presently at approx. 9793.3) and 61.8% retracement (presently at approx. 9712) of the recent up move (from approx. 9449 to 10138) The probable resistance in the hourly chart could be seen at 8 hours moving average (presently at approx. 9856), 13 hour moving average (presently at approx.9883), 20 hour moving average (presently at approx 9912.3) and 200 hour moving average (presently at approx. 9933.60).
The expected downward price level based on Fibonacci retracement of the up move from the previous bottom (approx.9448.8. to 10137.9) comes at 9793.3 (50%), 9712 (61.8%) and 9596.2 (78.6%).
The hourly CCI, RSI and stochastic looks bearish and are in oversold zones. Moreover, the rising ADX line also suggests downside momentum in the hourly price chart is very much in its speed. Overall Nifty remains bearish in the hourly time frame.
However, if any pullback sustains above 13-hour moving average, Nifty may give sharper pullback.
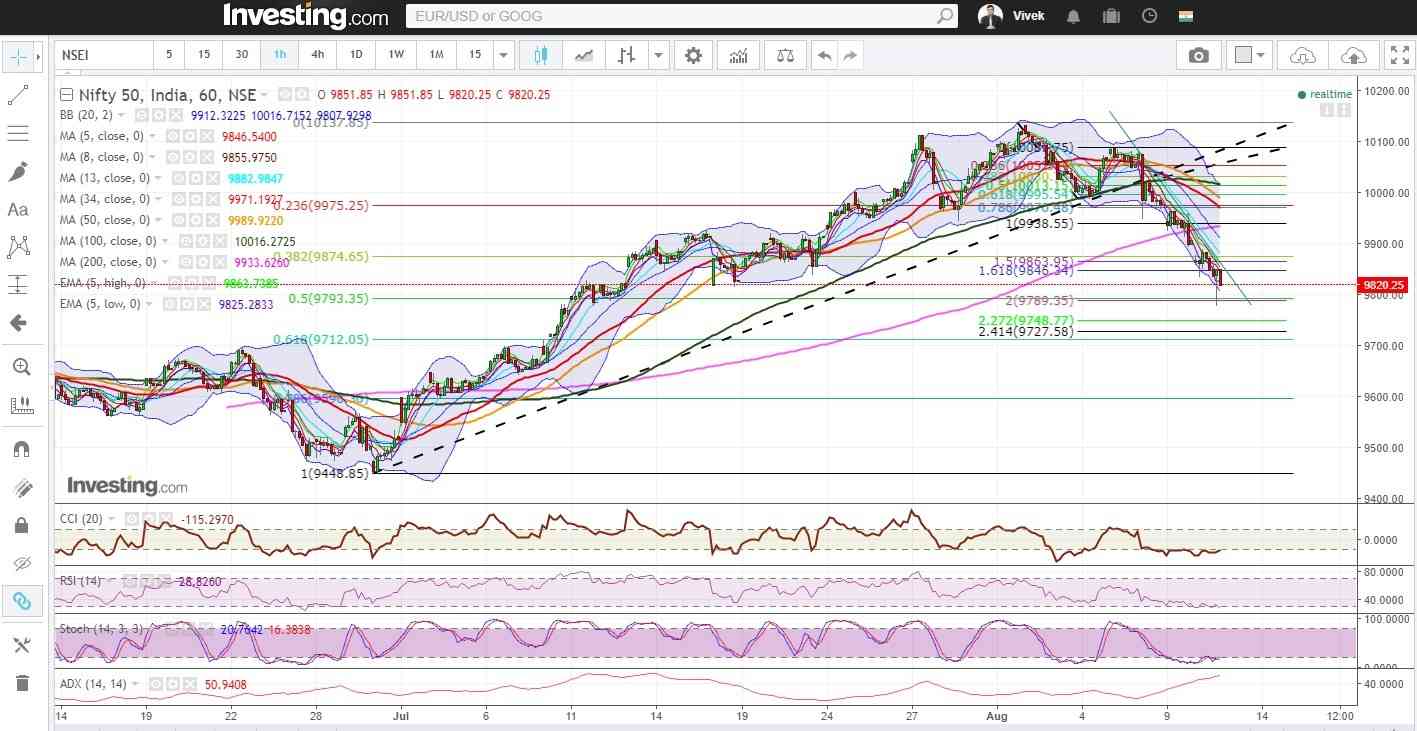
Nifty Hourly Chart
Daily Technical:
In the daily time frame, the market broke 34 DMA (presently at approx. 9838.1) after today’s gap down session.
However, the 50 DMA (presently at approx. 9772.8) acted as a good support zone for the market from the vicinity of which Nifty saw a little recovery to close at 9820.3.
The next probable support in the daily chart remains at 50 DMA (presently at approx. 9772.8) and 100 DMA (presently at approx. 9532.3).
On the upside, the probable resistance could be 5 days Low EMA (presently at approx. 9899.8)
Slow stochastic and RSI are still downward facing and trying to reach their lower bound. Moreover, CCI has closed below -100 line which suggests that bears are gaining momentum in the daily chart.
If Nifty closes below 9712 (61.8% retracement of the move from approx. 9449 to approx. 10138), the 8-month-old up move may get threatened. Hence Nifty uptrend is almost at make or break level at present juncture.
Learn Technical Analysis by enrolling in NSE Academy Certified Technical Analysis course.
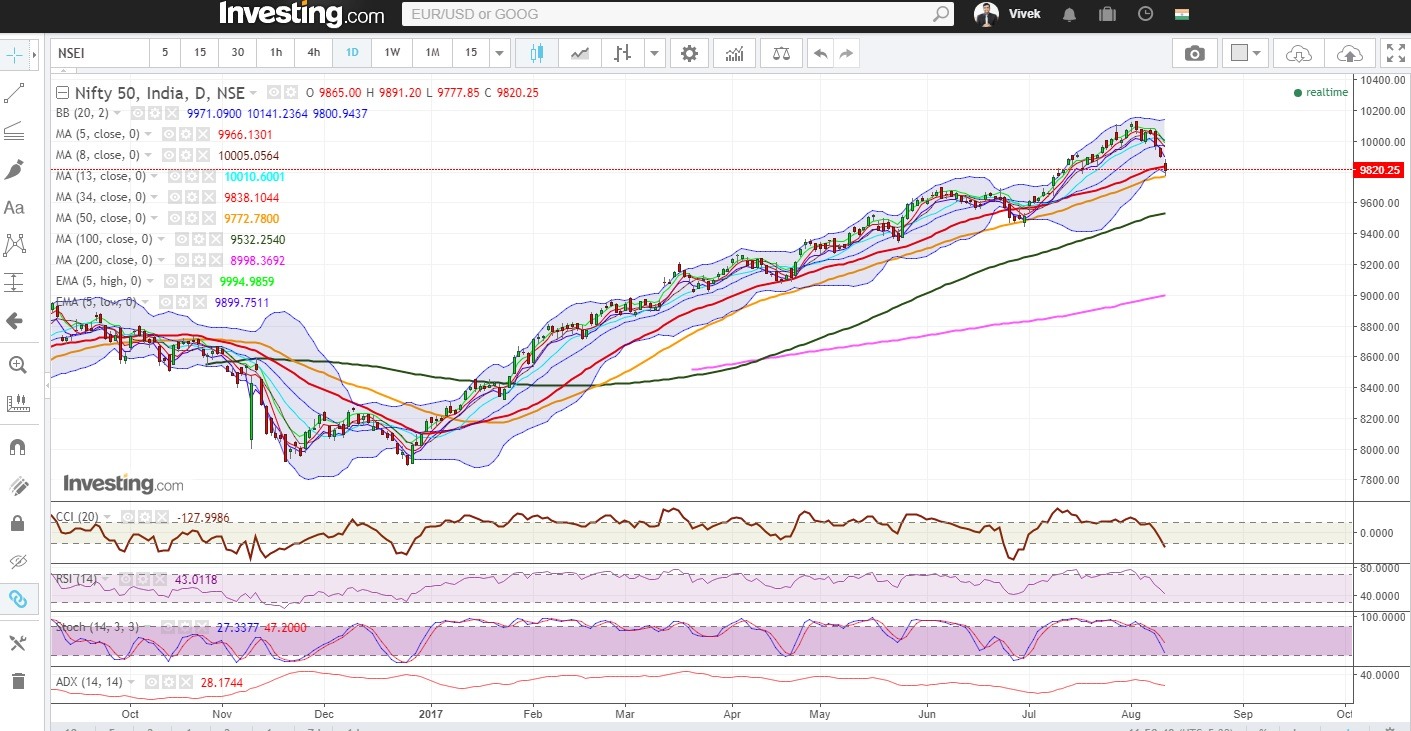
Nifty Daily Chart
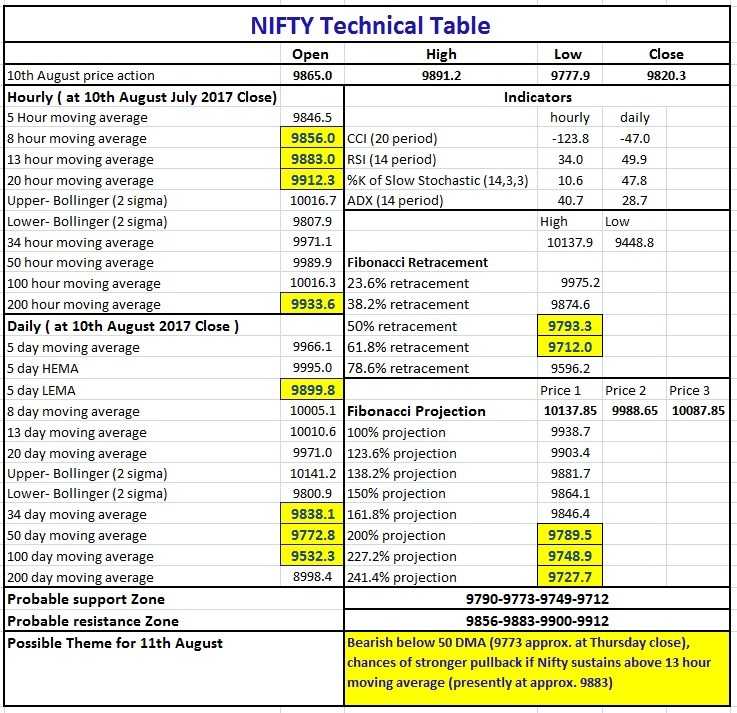
Nifty Tech Table
Watch the video below to learn to interpret the above tech table:


