Nifty close 10480.6: Nifty managed to close in green for the third consecutive week amidst volatility. There is a high possibility that Nifty may face strong resistance at 10500 and today’s doji formation at the resistance area suggests indecision in the market. It is very likely that Nifty may consolidate in 10000-10500 area for couple of months before any fresh move.
Hourly Technical
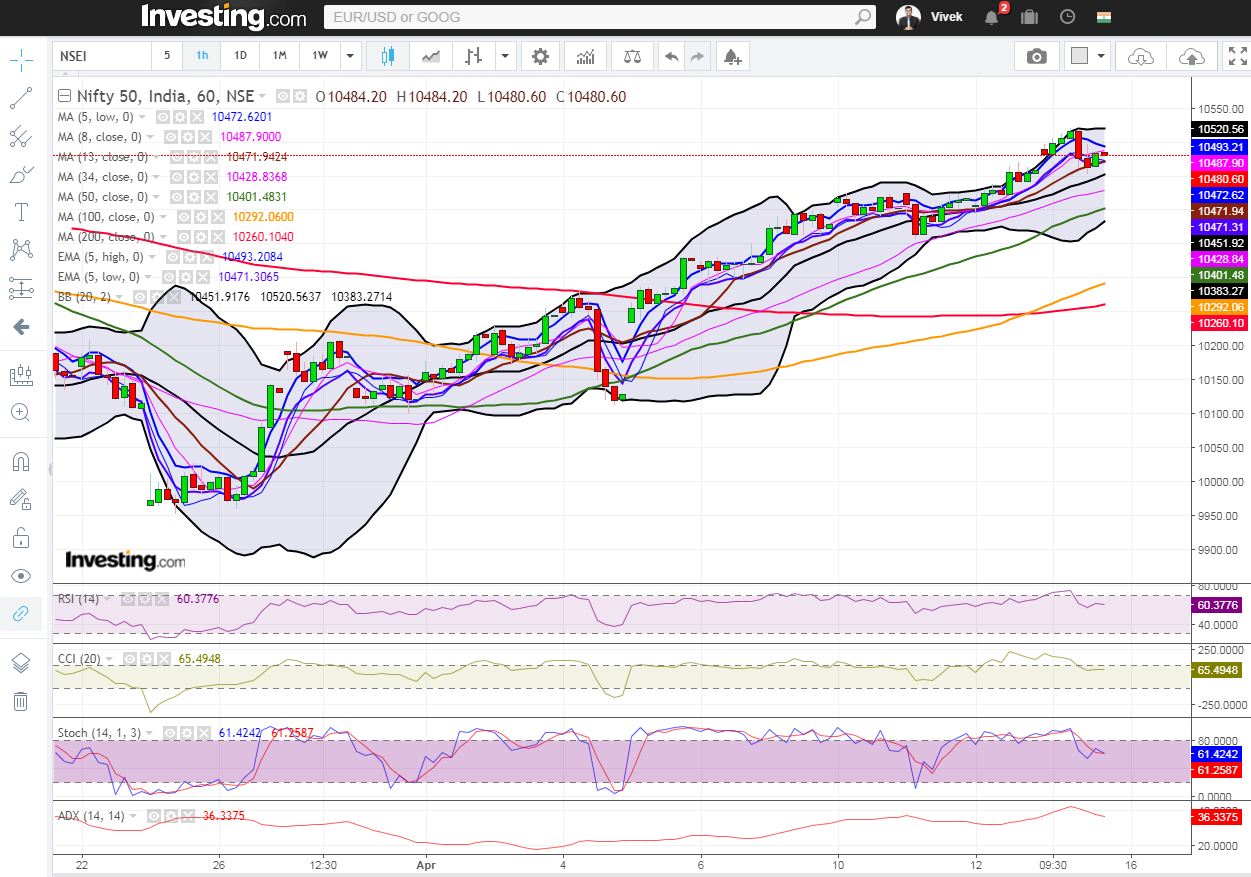
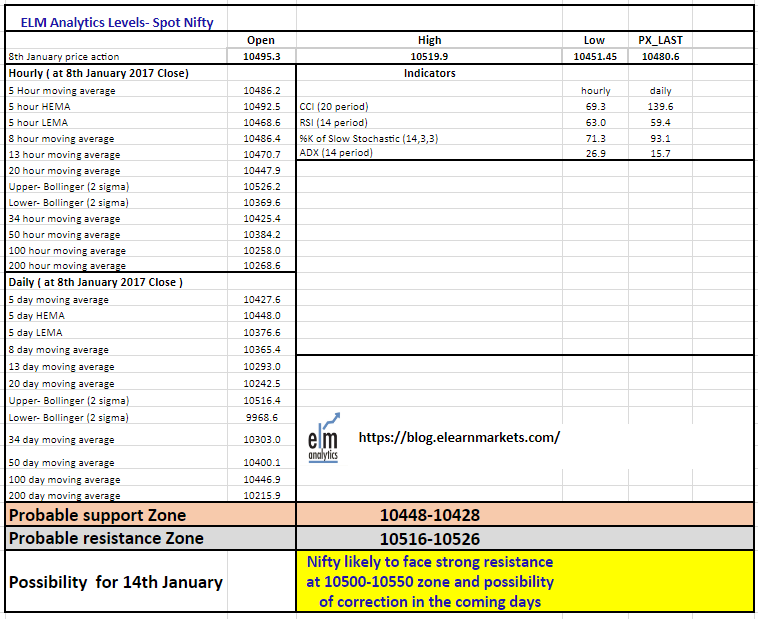
In the hourly chart, Nifty is trading above most short term moving averages. The probable support in the hourly chart comes at 20 Hour moving average (presently at approx. 10447.9) and 34 Hour moving average (presently at approx. 10425.4).
On the upside, Nifty may face resistance at Upper Bollinger line (presently at approx. 10526.2).
Hourly RSI, Stochastic and CCI are trading close to the upper bound of their respective range suggesting strength in the hourly time frame. Overall, Nifty appears very strong in the Hourly chart.
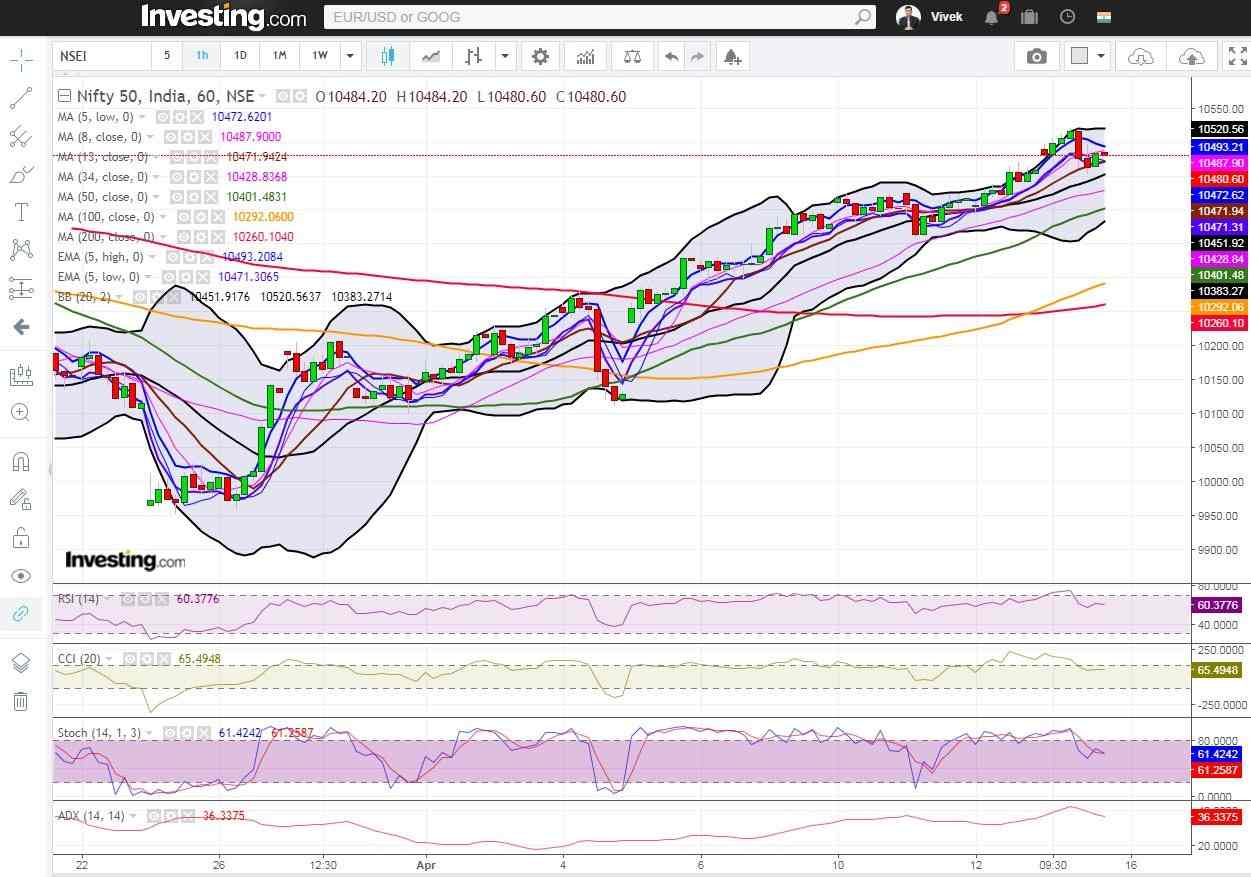
Hourly Chart
Daily Technical
In the daily chart, Nifty is trading above 5 week High EMA and also above most moving average suggesting upside momentum. However, doji candle in today’s chart may suggest tug of war between the bulls and the bears.
The probable support in the daily chart comes at 5 Day high EMA (presently at approx.10448) and 5 Day SMA (presently at approx.10427.6).
On the upside, Nifty may face resistance at Upper Bollinger line (presently at approx.10516.4).
Daily Stochastic and CCI are trading above the upper bound of their respective level and RSI is in the normal zone. Overall, Nifty remained neutral to bullish in the daily chart.
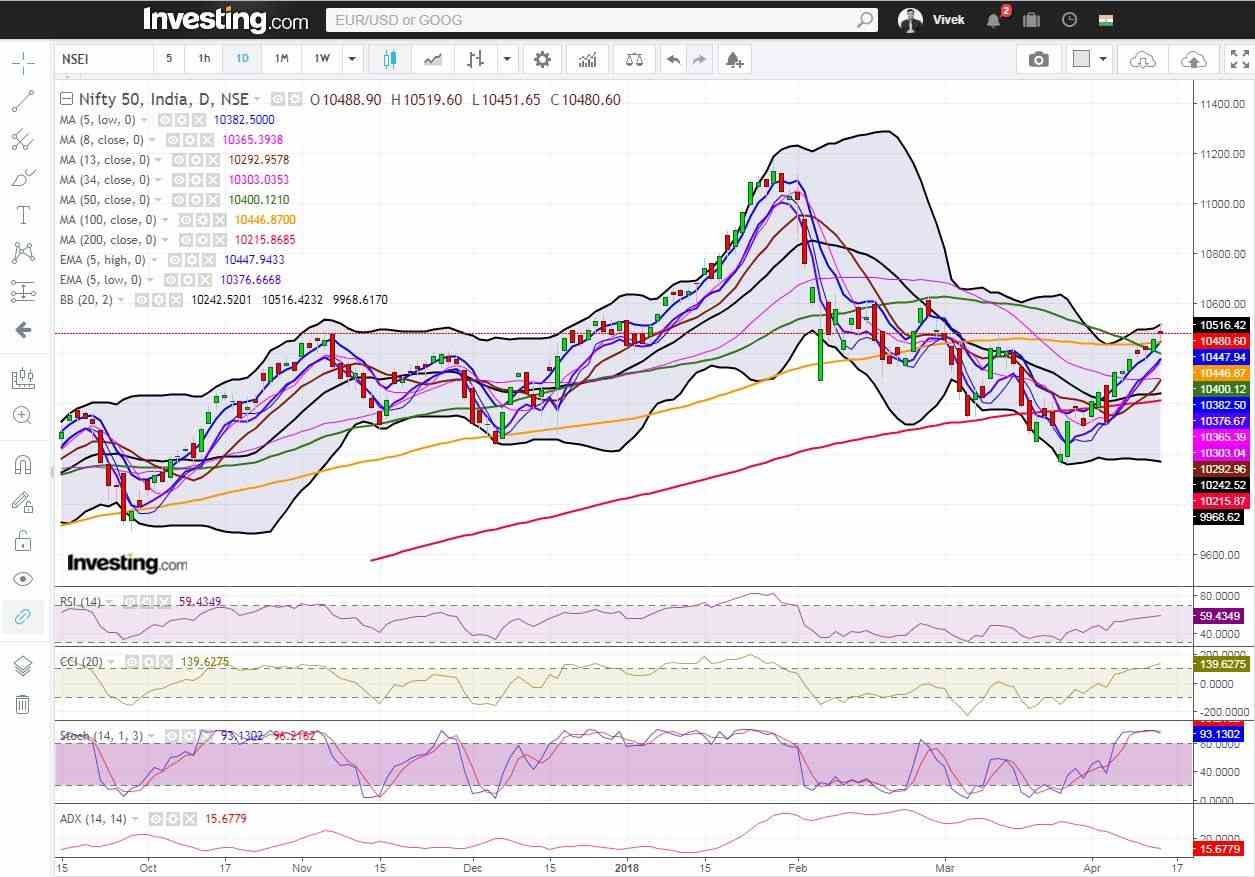
Daily Chart
Weekly Technical
Nifty has given a positive close for the third consecutive week and presently standing at a very crucial level. The close above 10500-10550 area may take Nifty to further higher levels but there is a high possibility of a correction from the present resistance level. Weekly CCI, RSI and Stochastic are in the normal zone. Overall, Nifty remained neutral in the weekly chart.
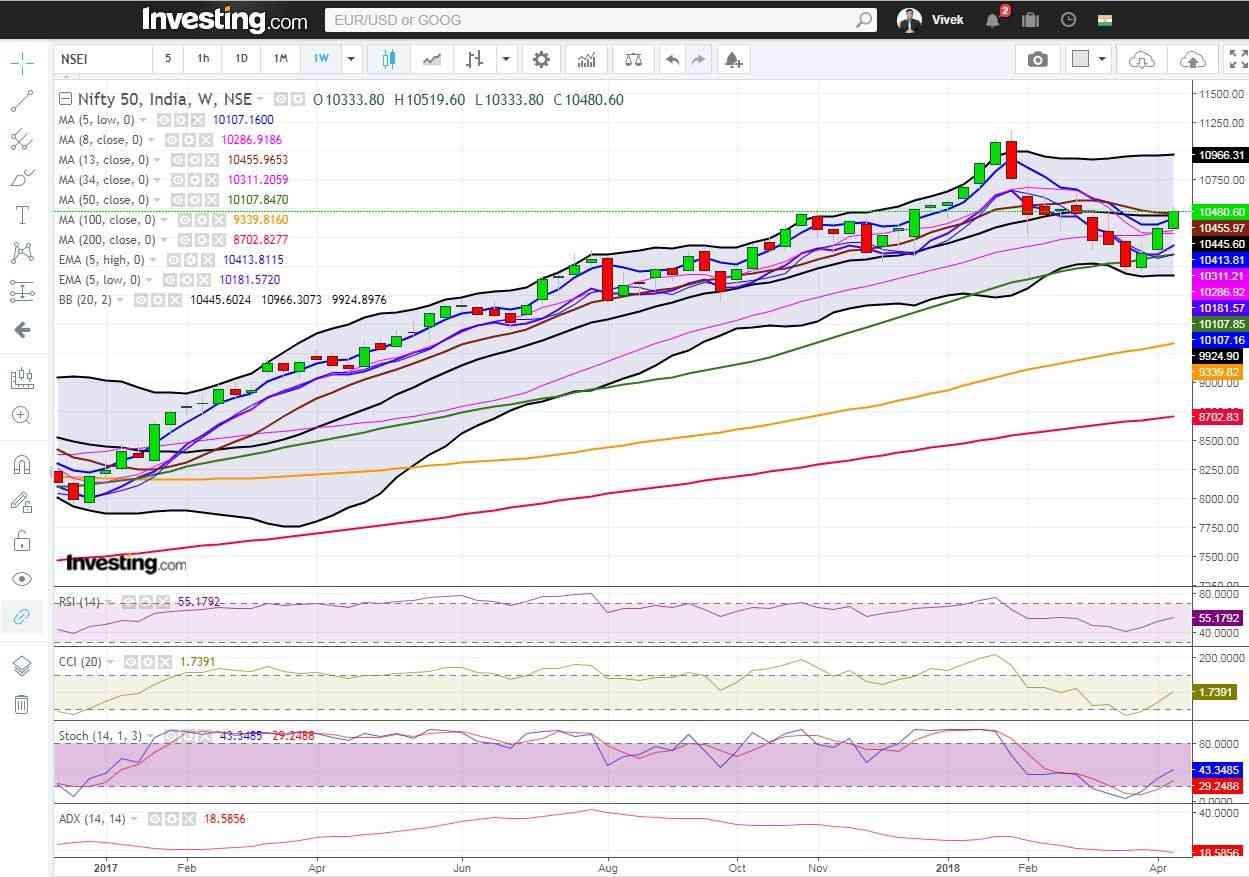
Weekly Chart
Nifty Tech Table


