Nifty close 10363.7: Nifty began the week on a positive note with the closing above 10350-mark. The index looks pretty strong in the daily timeframe and the present uptrend is likely to continue in the coming days.
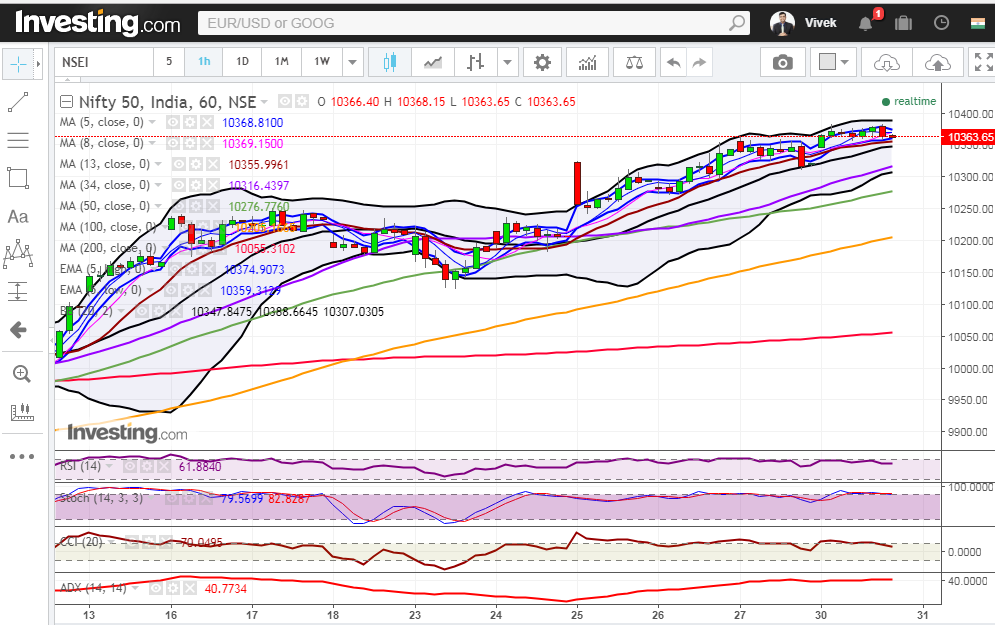
Hourly Technical:
In Hourly chart, Nifty opened marginally higher and hit a fresh high in today’s narrow range bound session. The probable support in the hourly chart comes at 20 Hour moving average (presently at approx.10347.8) and 34 Hour moving average (presently at approx.10316.4).
On the upside, Nifty may face resistance at 5 Hour High EMA (presently at approx. 10374.9) and Upper Bollinger line (presently at approx.10388.7).
Hourly Stochastic, CCI and RSI are close to the upper bound of their respective normal zone and ADX has turned up suggesting gain in momentum in the hourly chart. Overall Nifty remains bullish in the Hourly chart.
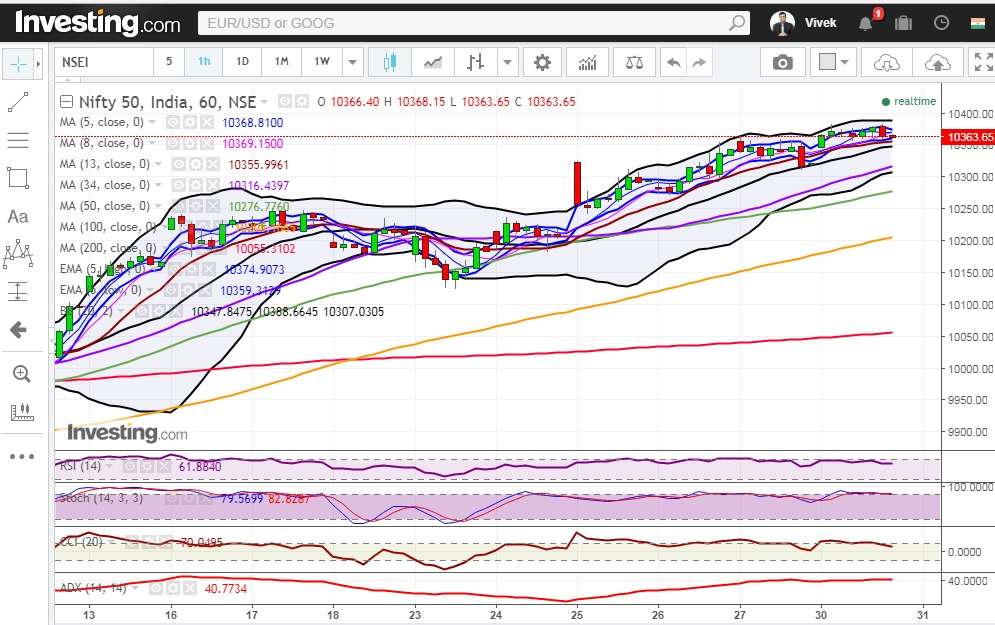
Figure: Hourly Chart
Daily Technical:
In the daily chart, Nifty is still above 5 Day High EMA and also above all short term moving averages indicating a positive bias. The probable support in the daily chart comes at 5 Day High EMA (presently at approx.10339.1) and 5 DMA (presently at approx.10306.7).
On the upside, Nifty may face resistance at Upper Bollinger line (presently at approx.10448.4).
Stochastic, CCI are in the overbought zone while RSI is marginally below its upper bound. Overall Nifty remains bullish in the daily chart.
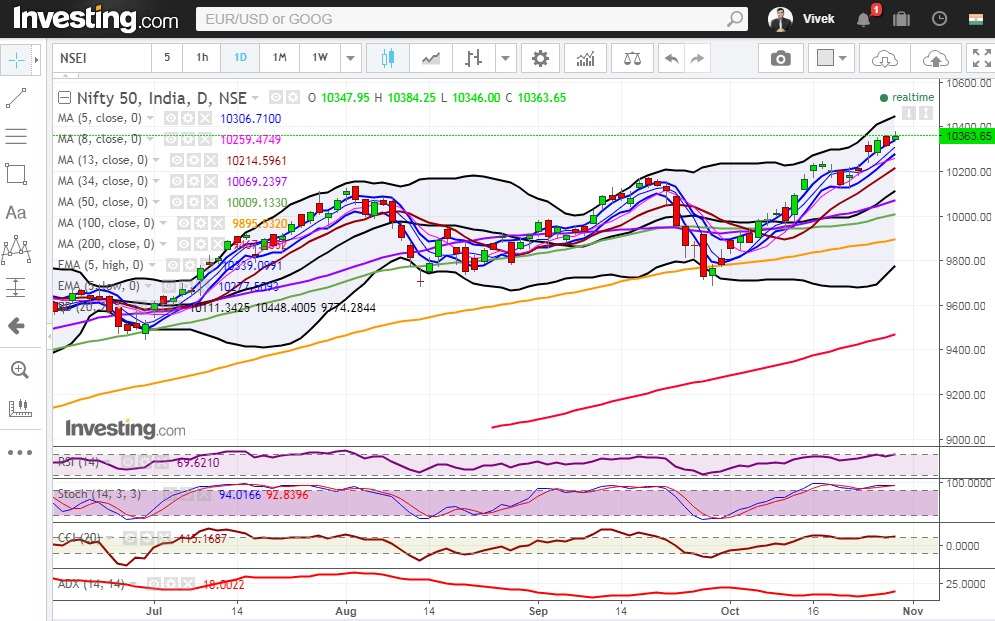
Figure: Daily Chart
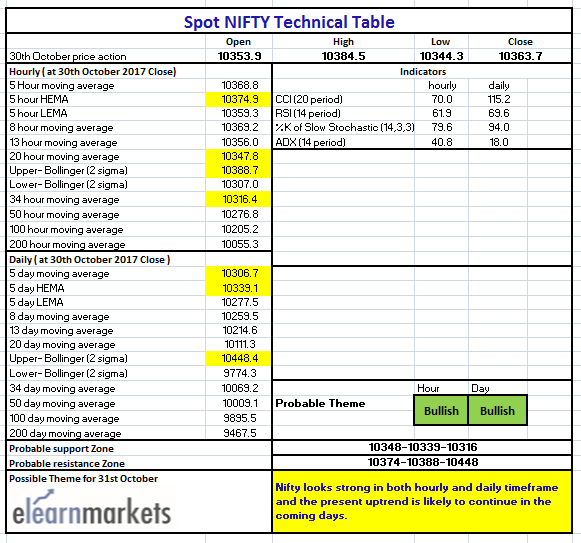
Figure: Tech Table


