Bank Nifty opened at 24842 this morning, the Index moved by 229 points today and closed marginally above its 5 day high EMA (24988 approx).
Hourly Technicals:
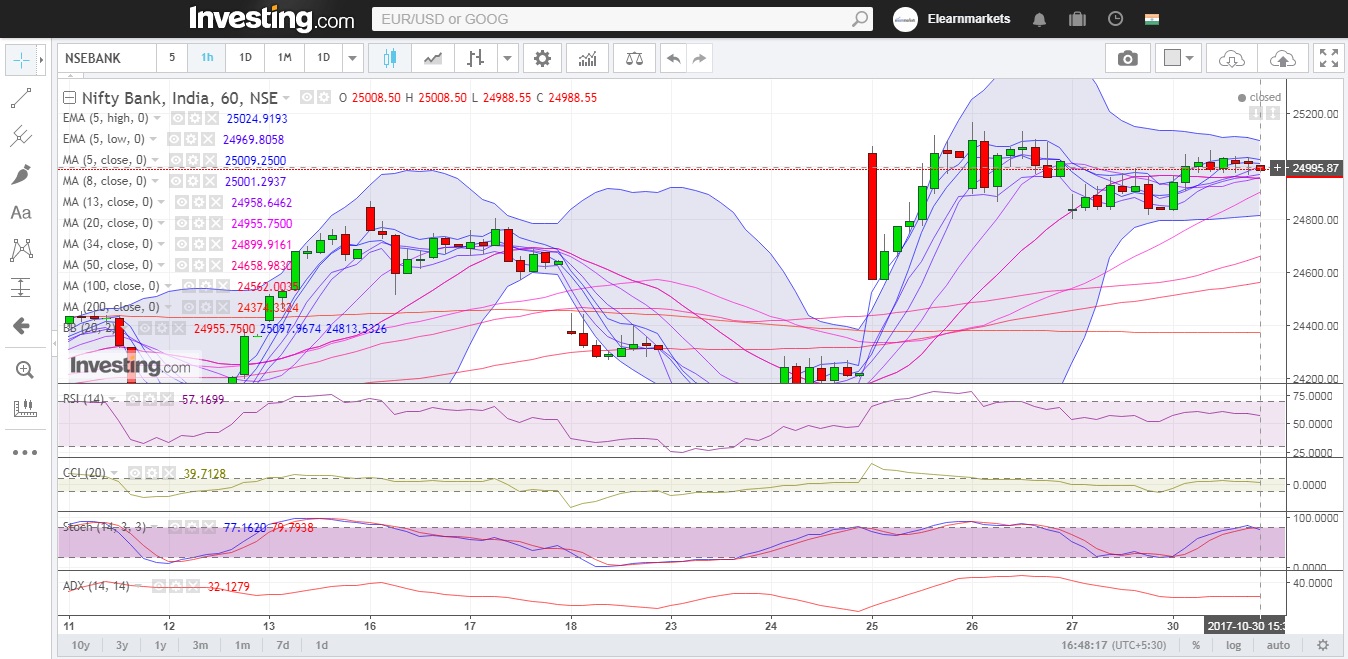
In the Hourly Chart, Bank Nifty has closed below its 5 hourly high EMA (25024 approx).The Index is likely to face its first resistance around its upper Bollinger Band ( 25100 approx).
If Bank Nifty breaks and closes below its 34 hourly MA(24900 approx), it will find its next support around its 50 hourly MA( 24659 approx) . The next support area for the index is around its 100 hourly MA ( 24560 approx).
Hourly RSI stands near the higher end of the normal range. The CCI is indicating sentiments are turning neutral.The ADX is indicating that volatility is likely.
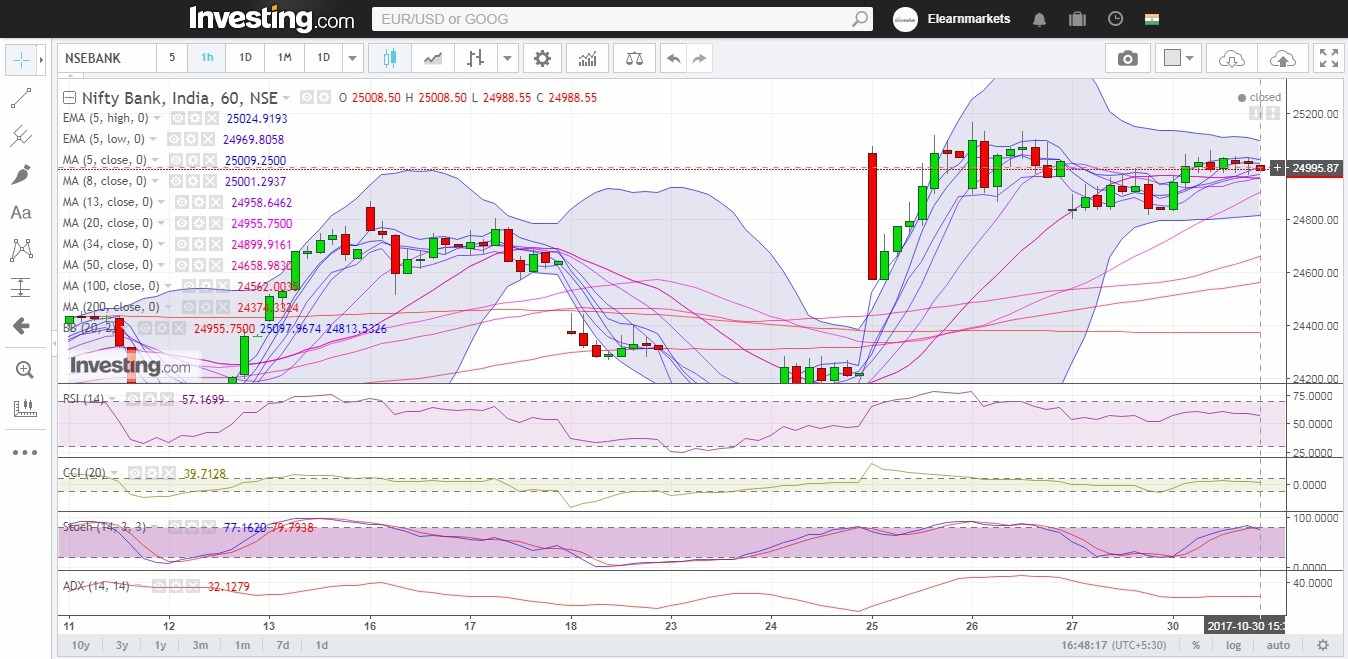
Figure: Bank-Nifty Hourly Chart
Daily Technicals:
The daily chart indicates that Bank Nifty has closed above its 5 day high EMA (24988 approx).
The Index will face resistance around its upper bollinger band(25102 approx). On the downside however,if Bank Nifty breaks and closes below its 5 DMA(24800 approx), it will find support around its 5 day low EMA (24655 approx).
The daily RSI has closed near its upper range. The CCI however is indicating massive positive sentiments.The ADX indicates lack of momentum.
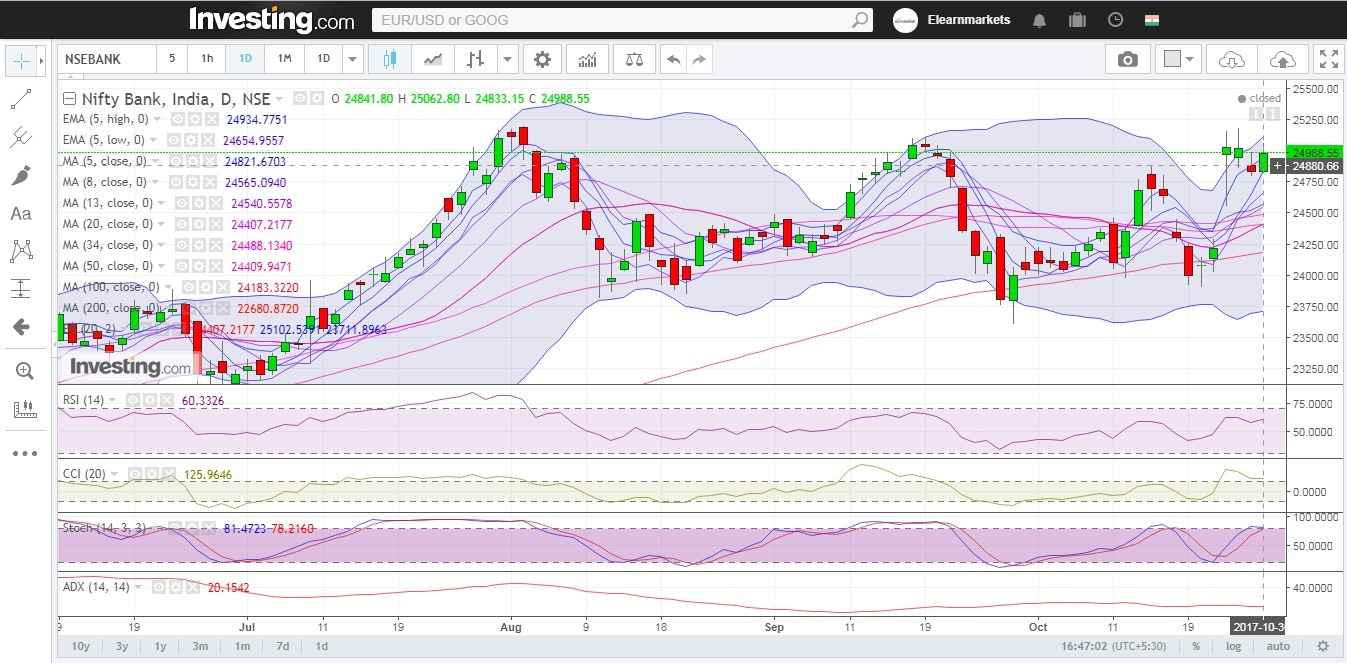
Figure: Bank-Nifty Daily Chart
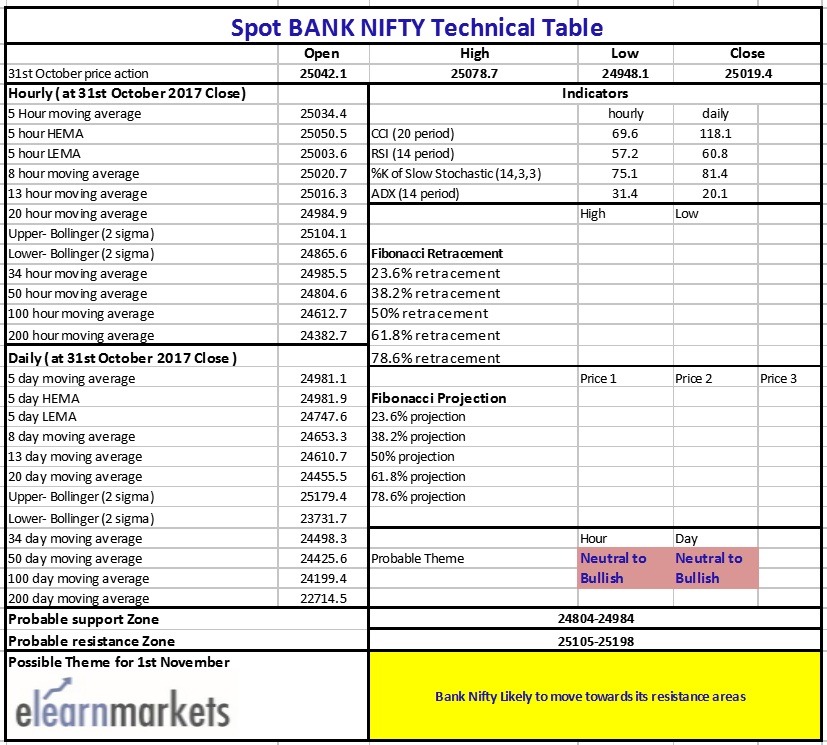
Figure: Bank-Nifty Tech Table


