Elearnmarkets - Financial Market Learning
  • Categories
    • Basic Finance
    • Derivatives
      • Futures
      • Options
    • Financial Planning
    • Fundamental Analysis
    • Technical Analysis
    • Marketshala
    • Miscellaneous
  • Language
    • English
    • Hindi
    • Bengali
No Result
View All Result
  • Courses
  • Webinars
  • Stories
Elearnmarkets - Learn Stock Market, trading, investing for Free
No Result
View All Result
Home Technical Analysis Market Analysis
9th April Nifty Hourly Chart

Nifty Ended above 10300 Levels Amidst Strong Volatility

Elearnmarkets by Elearnmarkets
September 6, 2023
in Market Analysis, Market Wrap
Reading Time: 3 mins read
0
62
VIEWS
Share on FacebookShare on XShare on WhatsApp

Nifty close 10331.6: Nifty ended in green for the second consecutive week amidst global trade worries. The boost in investor sentiment after RBI’s announcement that it expects the GDP growth to rise to 7.4 percent and also anticipates inflation level to fall in the coming year; led the market rally more than 2% on Thursday’s session

Hourly Technical

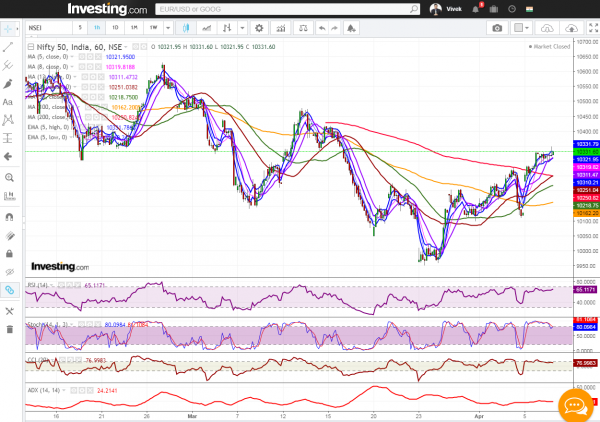
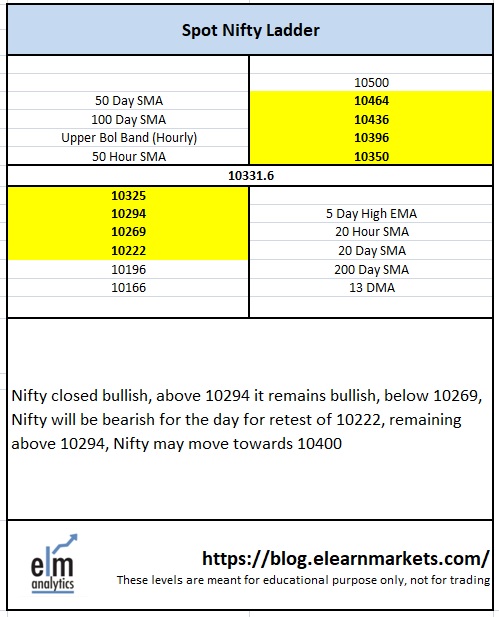
In the hourly chart, Nifty is trading above all short term moving averages. The probable support in the hourly chart comes at 20 Hour moving average (presently at approx. 10269).

On the upside, Nifty may face resistance at 50 Hour moving average (presently at approx. 10350) and Upper Bollinger line (presently at approx. 10396).
Hourly RSI, Stochastic and CCI are trading close to the upper bound of their respective range suggesting strength in the hourly time frame. Moreover ADX is gradually going up further confirming the gain in upside momentum. Overall, Nifty appears very strong in the Hourly chart.
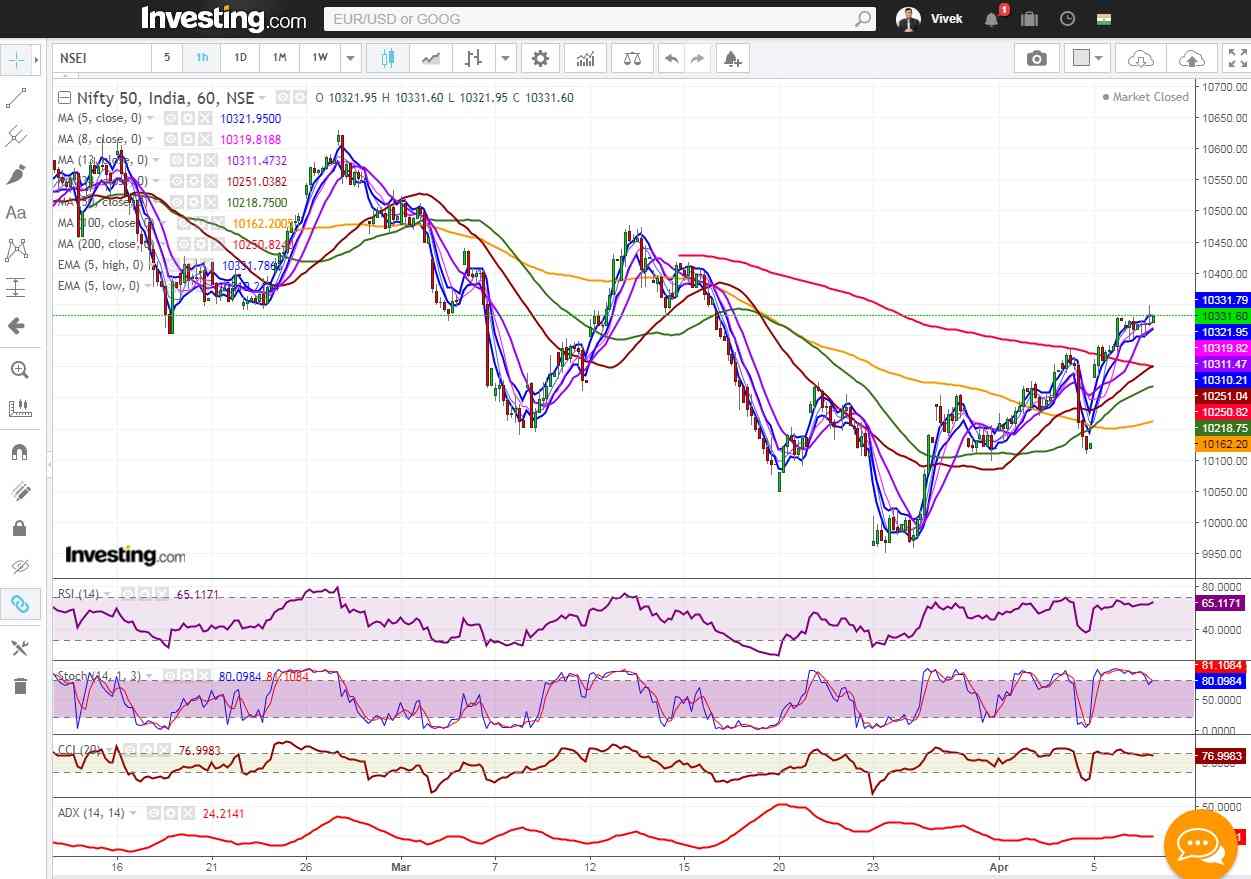
9th April Nifty Hourly Chart, Nifty is trading above all short term moving averages. The probable support in the hourly chart comes at 20 Hour moving average

Hourly chart

Daily Technical

In the daily chart, presently Nifty is trading above important 200 DMA and 5 Day High EMA which appears positive in the short term.

RelatedPosts

Weekly Chart

Huge Sell-Off Makes the Market Close in a Negative Note on the Expiry Week

August 22, 2023
184
Hourly Chart

Nifty Ends in Green. Rupee Appreciates and Falling Crude Price Helped the Market to Recover Approx. 140 Point

August 31, 2023
131
Hourly Chart

Sell Off Continues. Nifty Ends The Week With Three Consecutive Red Candles

September 4, 2023
144

The probable support in the daily chart comes at 5 Day high EMA (presently at approx.10294) and 20 Day SMA (presently at approx.10222).

On the upside, Nifty may face resistance at 100 Day SMA (presently at approx.10436) and 50 Day SMA (presently at approx. 10464).

Daily Stochastic and CCI are trading very close to the upper bound of their respective level and stochastic is in the normal zone. Overall, Nifty remained neutral to bullish in the daily chart.
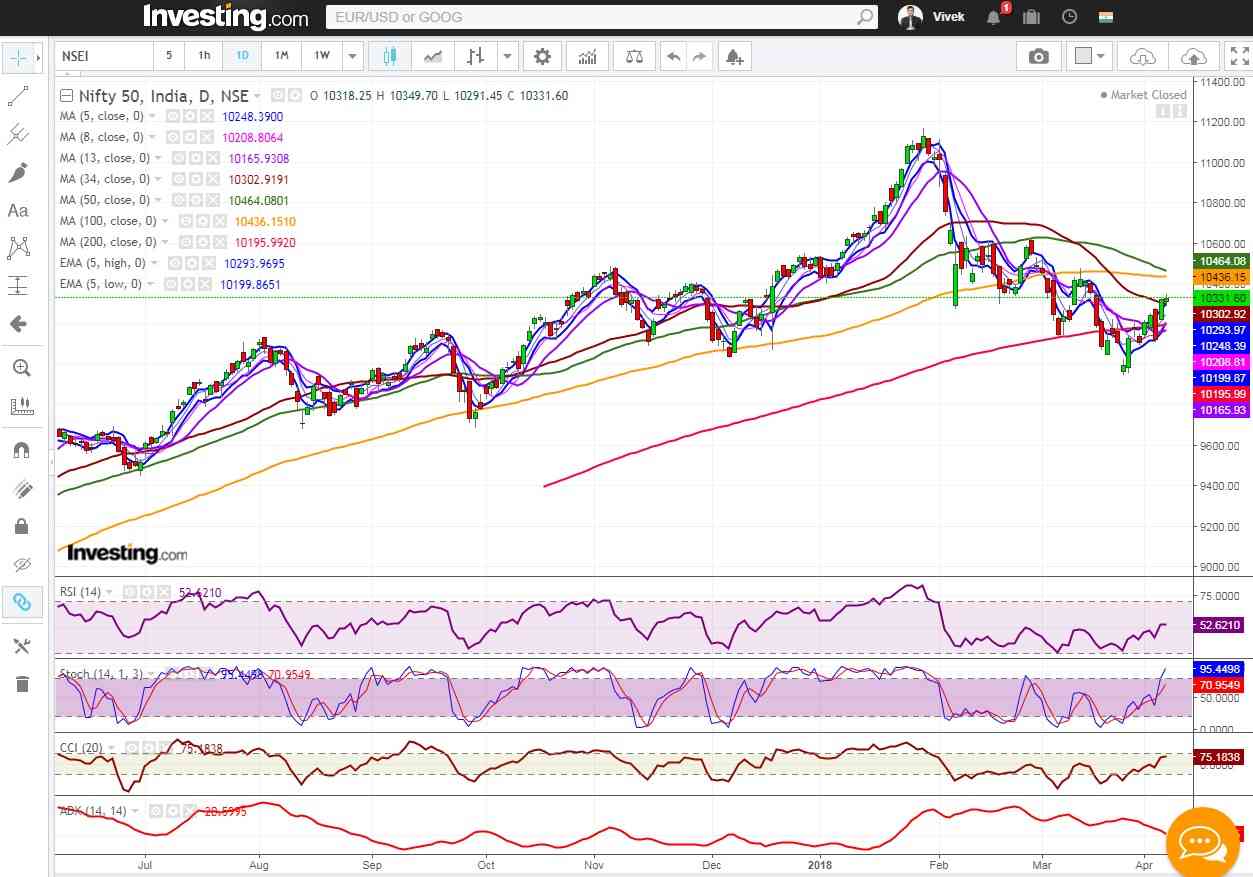
Nifty 50 daily technical showing Stochastic and CCI are trading very close to the upper bound of their respective level and stochastic is in the normal zone

Daily chart

Weekly Technical

Nifty rallied for the second consecutive week after bouncing off the 50 week SMA and presently trading above 34 week SMA. As of now it seems that market has turned on the upside but in case of any further negative sentiment, 9700 may act as a very strong support which is a convergence of uptrend line and support line.
Weekly CCI and Stochastic are in the lower bound of their respective range while RSI is in the normal zone. Overall, Nifty remained neutral in the weekly chart.
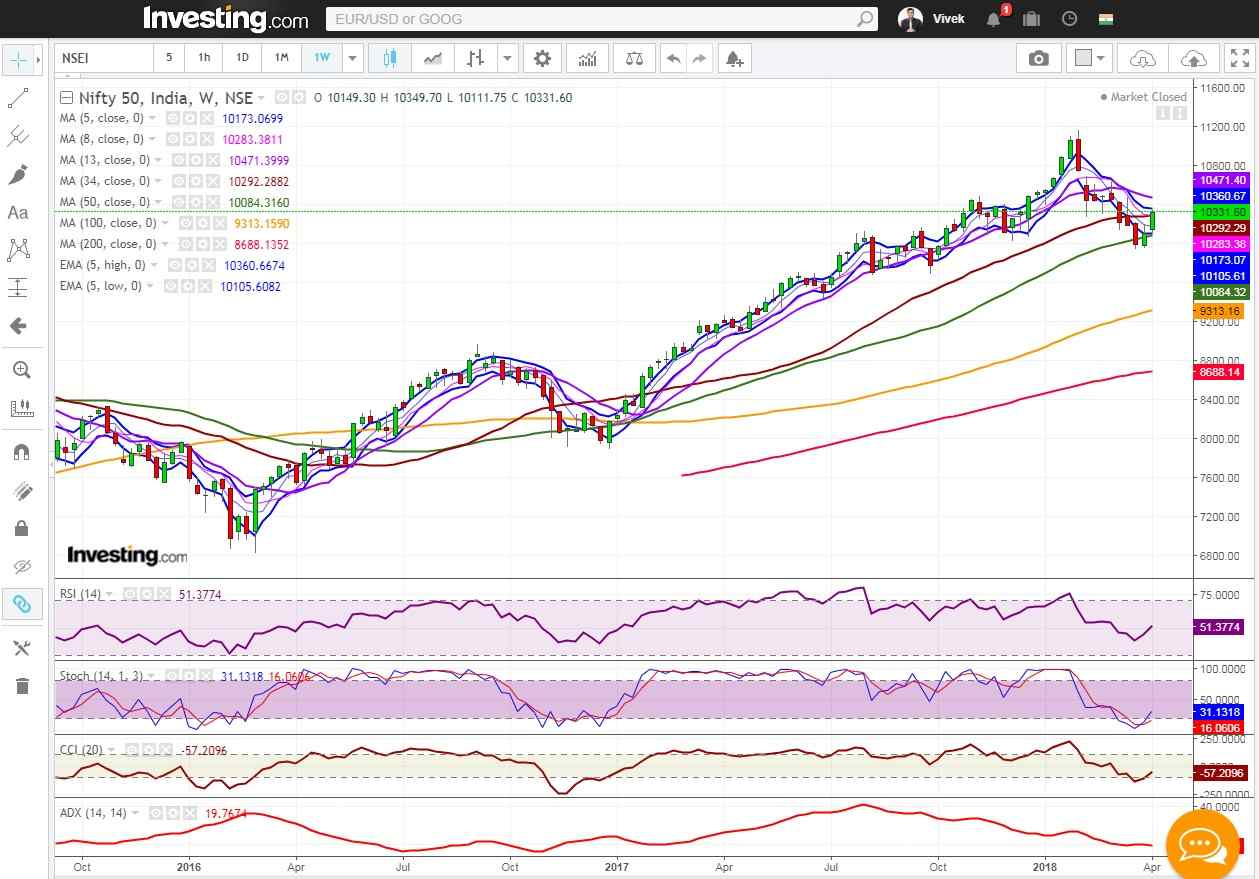
Nifty Ended above 10300 Levels Amidst Strong Volatility 1


Weekly Chart

Nifty ELM Matrix


Nifty ELM Matrix

Tags: english
ShareTweetSend
Get Kotak Offer Get Kotak Offer Get Kotak Offer
Previous Post

How to trade the Price Channel Continuation pattern

Next Post

Large Cap Equity Mutual Funds – Why always a preferred asset class over others?

Elearnmarkets

Elearnmarkets

Elearnmarkets (ELM) is a complete financial market portal where the market experts have taken the onus to spread financial education. ELM constantly experiments with new education methodologies and technologies to make financial education effective, affordable and accessible to all. You can connect with us on Twitter @elearnmarkets.

Related Posts

Weekly Chart
Market Analysis

Huge Sell-Off Makes the Market Close in a Negative Note on the Expiry Week

August 22, 2023
184
Hourly Chart
Market Analysis

Nifty Ends in Green. Rupee Appreciates and Falling Crude Price Helped the Market to Recover Approx. 140 Point

August 31, 2023
131
Hourly Chart
Market Analysis

Sell Off Continues. Nifty Ends The Week With Three Consecutive Red Candles

September 4, 2023
144
Nifty Hourly Chart
Market Analysis

Nifty Witnessed A Flash Crash But Managed To Close Above 11100 Level

August 17, 2023
347

Leave a Reply Cancel reply

Your email address will not be published. Required fields are marked *

Elearnmarkets Logo

Follow Us

Facebook-f Twitter Instagram Linkedin-in Youtube Telegram

Register on Elearnmarkets

Continue your financial learning by creating your own account on Elearnmarkets.com

Register Free Account

Download App

Playstore logo
Download on app store

Categories

  • Basic Finance
  • Derivatives
  • Financial Planning
  • Fundamental Analysis
  • Technical Analysis
  • Marketshala
  • Miscellaneous

Popular On Elearnmarkets

  • Market Superheroes:
  • Vivek Bajaj
  • Chetan Panchamia
  • Ashish Kyal
  • Premal Parekh
  • Abhijit Paul
  • Jegan
  • Sivakumar Jayachadran
  • Vishal Malkan
  • Jyoti Budhia
  • Vivek Gadodia
  • Vishal Mehta
  • Piyush Chaudhry
  • Santosh Pasi
  • Gomathi Shankar
  • Market Superheroes:
  • Vivek Bajaj
  • Chetan Panchamia
  • Ashish Kyal
  • Premal Parekh
  • Abhijit Paul
  • Jegan
  • Sivakumar Jayachadran
  • Vishal Malkan
  • Jyoti Budhia
  • Vivek Gadodia
  • Vishal Mehta
  • Piyush Chaudhry
  • Santosh Pasi
  • Gomathi Shankar
  • Courses:​
  • Options Trading
  • Dow Theory
  • Momentum Trading
  • Stock Investing
  • Stock Market for Beginners
  • Harmonic Chart Patterns
  • Algo Trading
  • Elliot Wave Theory
  • Advanced Excel
  • Cryptocurrency
  • NSE Certification Course
  • Courses:​
  • Options Trading
  • Dow Theory
  • Momentum Trading
  • Stock Investing
  • Stock Market for Beginners
  • Harmonic Chart Patterns
  • Algo Trading
  • Elliot Wave Theory
  • Advanced Excel
  • Cryptocurrency
  • NSE Certification Course
  • Webinars:
  • Bank Nifty Scalping
  • Intraday Trading Strategies
  • Options Trading Strategies
  • Options selling
  • Price Action
  • Relative Strength
  • Tax Planning
  • Options Buying
  • Growth Stocks
  • Portfolio Management
  • Relative Strength Index
  • Risk Management
  • Renko Charts
  • Crude Oil
  • Traders Psychology
  • Moving Average
  • Multibagger Stocks
  • Free Learning Modules:
  • Intraday Trading
  • Options Scalping
  • Swing Trading
  • Financial Modelling
  • RSI Indicator
  • Bollinger Bands
  • Pricing of Futures
  • Personal Finance
  • Initial Public Offerings (IPO)
  • Value Investing
  • Technical Indicators
  • Candlesticks
  • Chart Patterns
  • Option Greeks
  • ELSS Funds
  • Banking and Insurance
  • Real Estate
  • Gold
  • Book Summaries:
  • Rich Dad Poor Dad
  • Psychology of Money
  • The Intelligent Investor
  • The Richest Man in Babylon
  • Think and Trade Like a Champion
  • Value Investing and Behavioural Finance
  • Trading in the Zone
  • Learn to Earn
  • Book Summaries:
  • Rich Dad Poor Dad
  • Psychology of Money
  • The Intelligent Investor
  • The Richest Man in Babylon
  • Think and Trade Like a Champion
  • Value Investing and Behavioural Finance
  • Trading in the Zone
  • Learn to Earn
  • Tools:
  • CAGR Calculator
  • SIP Calculator
  • eLearnOptions
  • Future Value Calculator
  • Present Value Calculator
  • Atal Pension Yojana
  • Cost of Delay Calculator
  • Become a Crorepati
  • Tools:
  • CAGR Calculator
  • SIP Calculator
  • eLearnOptions
  • Future Value Calculator
  • Present Value Calculator
  • Atal Pension Yojana
  • Cost of Delay Calculator
  • Become a Crorepati

© 2023 Elearnmarkets. All Rights Reserved

  • Visit Elearnmarkets
  • Courses
  • Webinars
  • Financial Guides
  • Get Free Counselling
  • Visit Elearnmarkets
  • Courses
  • Webinars
  • Financial Guides
  • Get Free Counselling

Get Elearnmarkets App

No Result
View All Result
  • Article Categories
    • Basic Finance
    • Derivatives
    • Financial Planning
    • Fundamental Analysis
    • Technical Analysis
    • Marketshala
    • Miscellaneous
  • Language
    • Hindi
    • Bengali
    • English
  • Courses
  • Webinars
  • Stories

© 2020 Elearnmarkets All Rights Reserved

View Details

Suggested Learning

Technical Analysis Made Easy

Technical Analysis Made Easy

Online Technical Analysis

Certification in Online Technical Analysis

Online ENCCMP

Online NSE Academy Certified Capital Market Professional (E-NCCMP)