Nifty close 10234.4: Nifty traded in a mere 40 points in today’s session and closed flat after consolidation but managed to end at record closing high.
Hourly Technical:
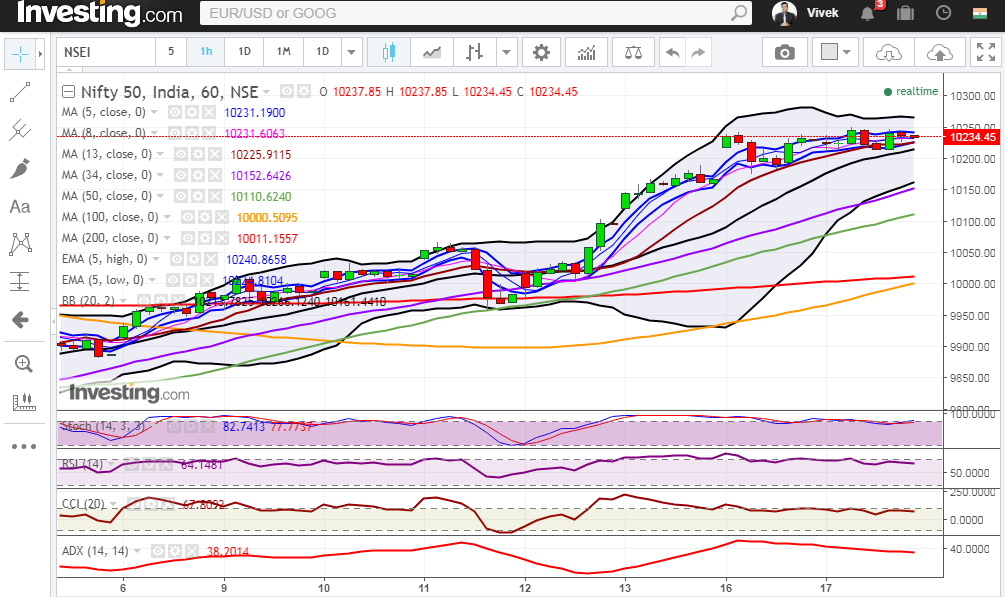
In the hourly chart, Nifty opened flat and closed above most short term moving averages suggesting strength. The probable support in the hourly chart comes at 20 Hour moving average (presently at approx. 10213.7), lower Bollinger line (presently at approx. 10161.4) and 34 Hour moving average (presently at approx 10152.6).
On the upside, Nifty may face resistance at upper Bollinger band line (presently at approx. 10266.1).
Hourly Stochastic are in the overbought zone while RSI and CCI are very close to their respective upper bound suggesting strength. Overall Nifty remains bullish in the Hourly chart.
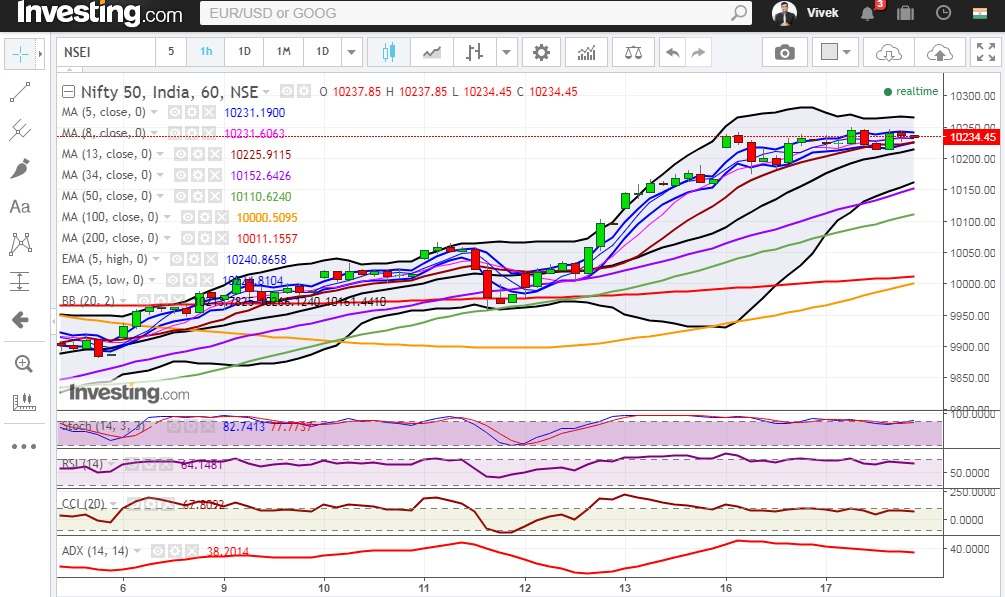
Figure: Hourly Chart
Daily Technical:
In the daily chart, Nifty has been rising since the last three consecutive days and is still above 5 Day High-Low EMA band suggests bulls in total control. The probable support in the daily chart comes at 5 Day High EMA (presently at approx.10179.6) and 5 DMA (presently at approx.10142.7).
On the upside, Nifty may face resistance at upper Bollinger line (presently at approx. 10286).
Daily CCI and Stochastic are in the overbought zone while RSI is very close to the upper bound suggesting strength in the daily chart as well. Moreover, ADX has again turned up which suggests that the present momentum may continue in the coming days.
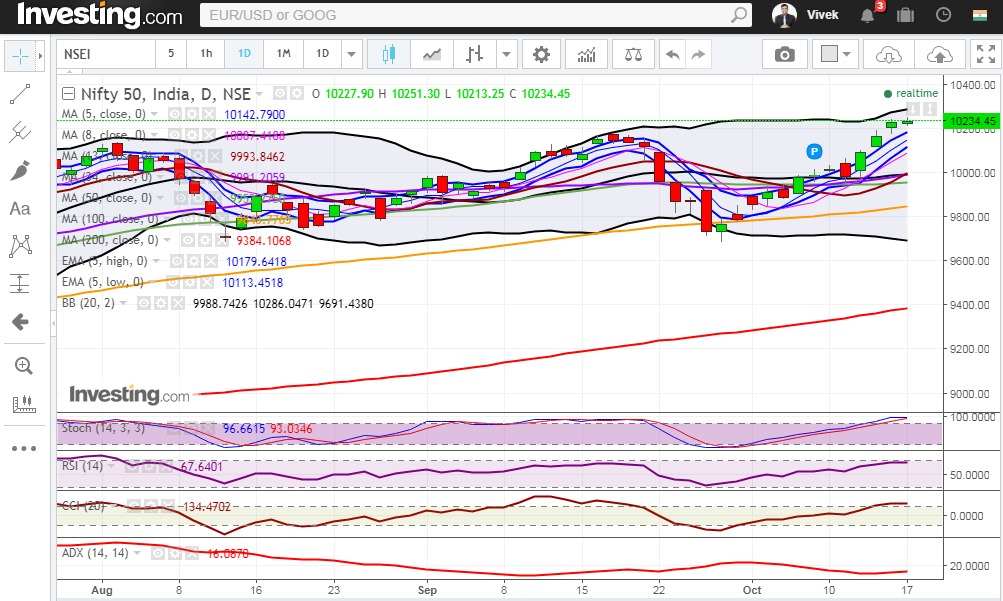
Figure: Daily Chart
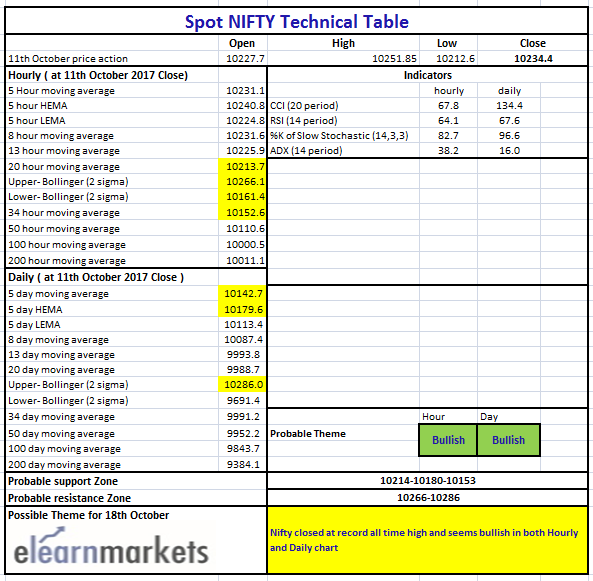
Figure: Tech Table


