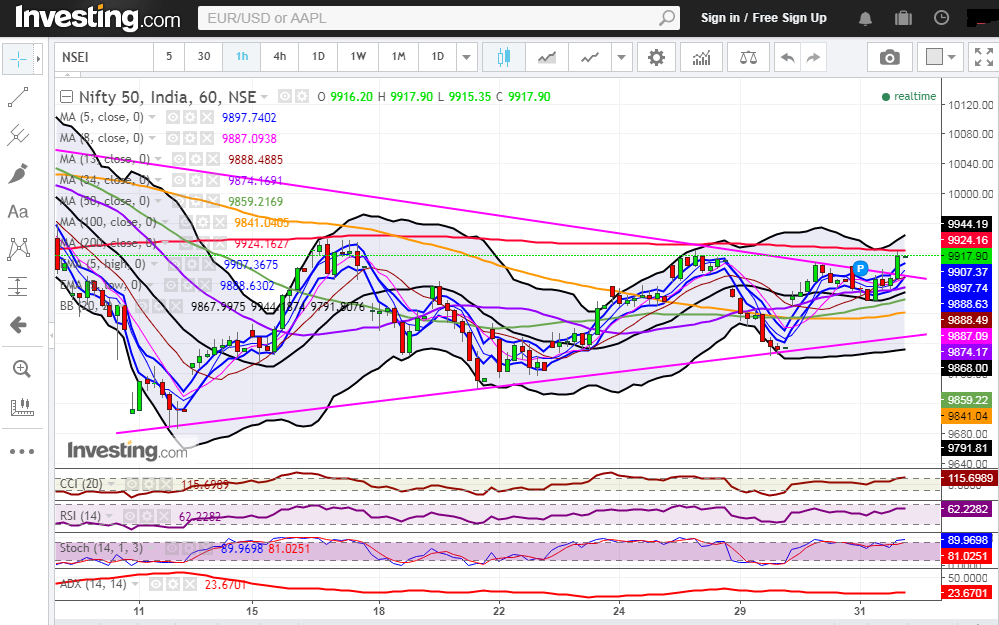
Nifty (Close 9917.9): Nifty breaks out of the Symmetrical triangle in the last hour, however it couldn’t breach the important 200 Hourly moving average (presently at approx. 9924.1), which acted as a strong resistance in the hourly chart.
Hourly Technical:
There is a possibility that Nifty may see some consolidation in the coming days.
This is the third time in the last 20 days that it couldn’t breach 200 Hourly moving average (presently at approx. 9924.1).
A price movement in any direction will decide Nifty’s move in the coming days.
So this is an important level to watch out for.
On the upside, Nifty may face resistance at 200 Hourly Moving Average (presently at approx. 9924.1), 61.8% retracement (presently at approx. 9965.8) and 78.6% retracement (presently at approx. 10041.5) of the down move from approx. 10137.9 to approx. 9687.5.
The probable support in the hourly chart comes at 20 Hour Moving Average (presently at approx. 9868) and 100 Hour moving average (presently at approx. 9841).
Hourly CCI and Stochastic are in the overbought zone and RSI is very close to the upper bound of the normal zone. However, the rising ADX indicates a gain of upside momentum.
Overall, Nifty remains bullish in the Daily chart.
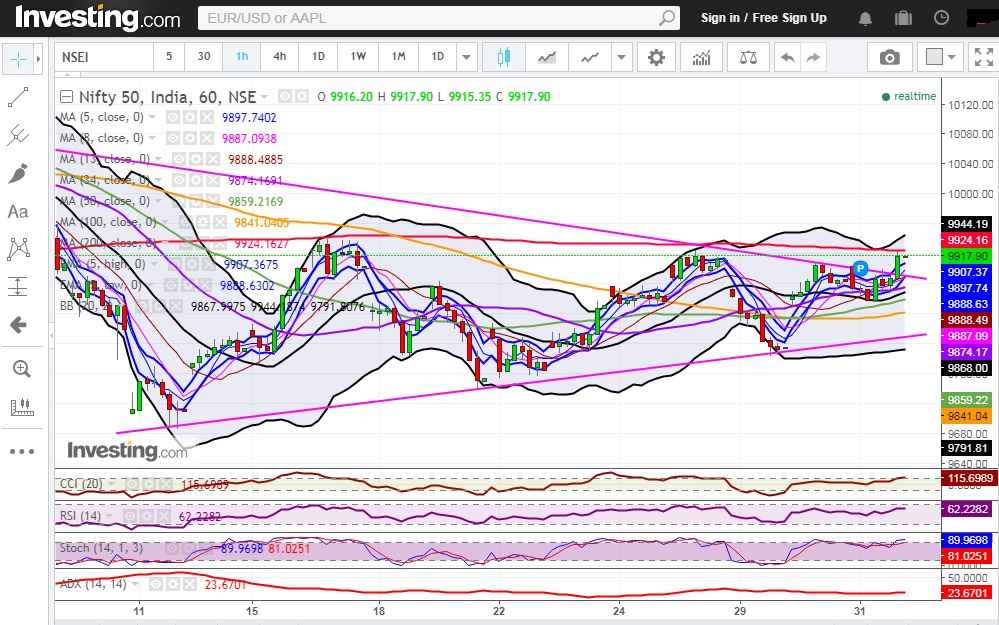
Figure: Hourly Chart
Daily Technical:
Nifty has closed above important resistance of 20 DMA or the mid-Bollinger line (presently at 9890.5) and also just above 34 DMA (presently at 9917.5). In the Daily chart, it has closed above most short-term moving averages.
The probable support in the daily chart comes at 50 DMA (presently at 9825.9).
Enroll in: NSE Academy Certified Technical Analysis course on Elearnmarkets to learn technical analysis from scratch.
The daily RSI, CCI and stochastic are still in the neutral zone. However, the declining ADX indicates lack of momentum. Overall, Nifty remains neutral in the Daily chart.
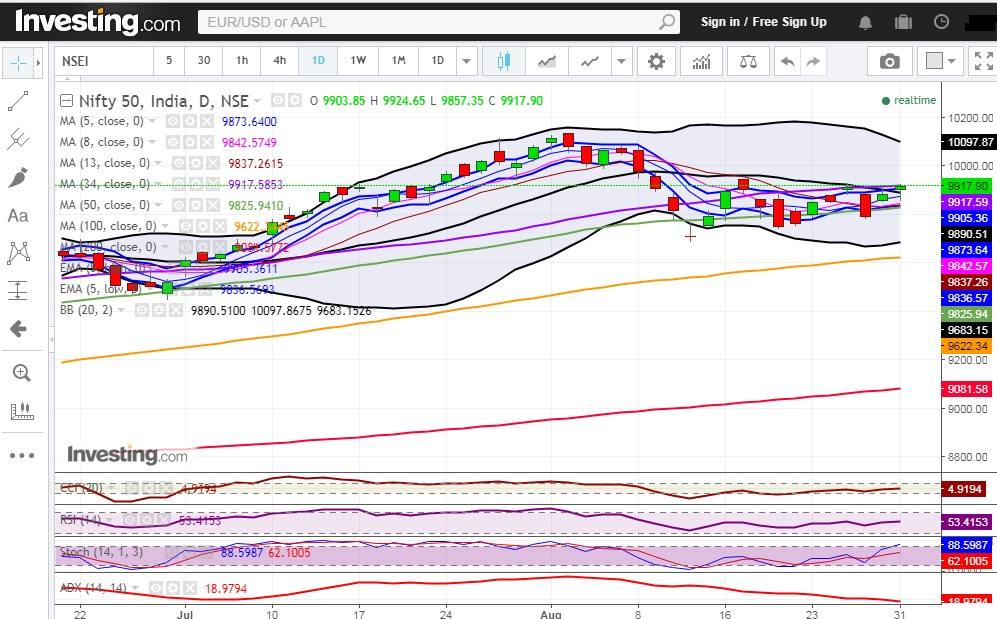
Figure: Daily Chart
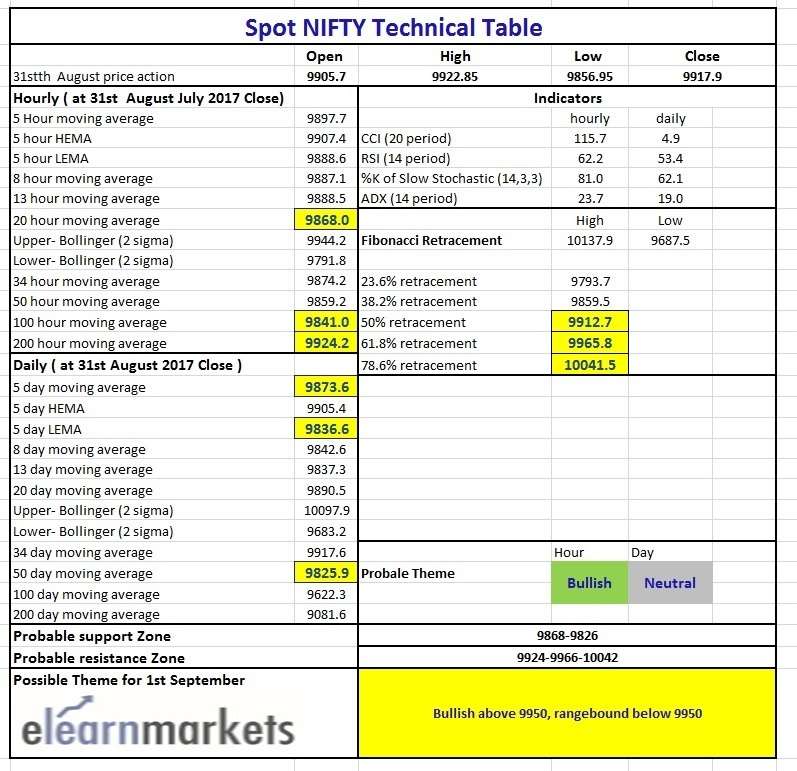
Figure: Tech Table
Watch the video below to learn how to analyze the above table:


