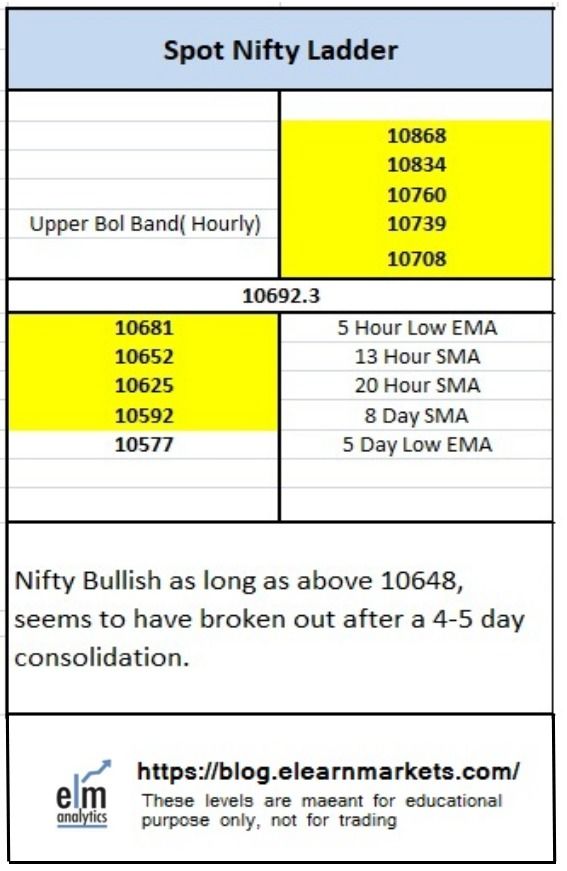
Nifty close 10692.3: Nifty came out of short term resistance of 10600 with a gap up on positive global cues and earnings optimism. Moreover there is a gap filling opportunity in the index and given the positive momentum, it seems that Nifty may soon cross 10760 in the near term.
Hourly Technical
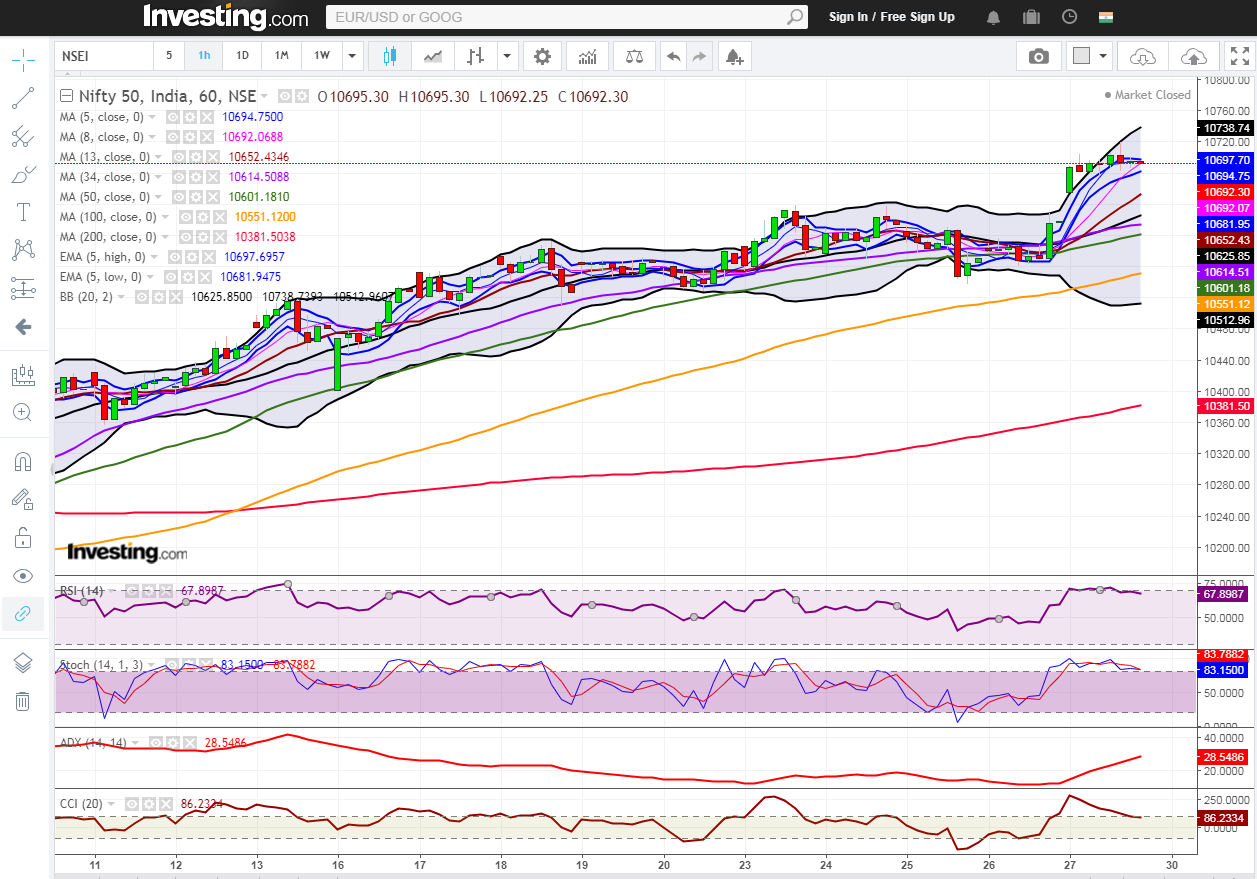
In the hourly chart, Nifty is trading above most short term moving averages. The probable support in the hourly chart comes at 13 Hour SMA (presently at approx. 10652) and 20 Hour SMA (presently at approx. 10625).
On the upside, Nifty may face resistance at upper Bollinger band (presently at approx. 10739).Hourly Stochastic is in the overbought zone while RSI and CCI are trading close to the upper bound of their respective range suggesting strength in the hourly time frame. Overall, Nifty appears strong in the Hourly chart.
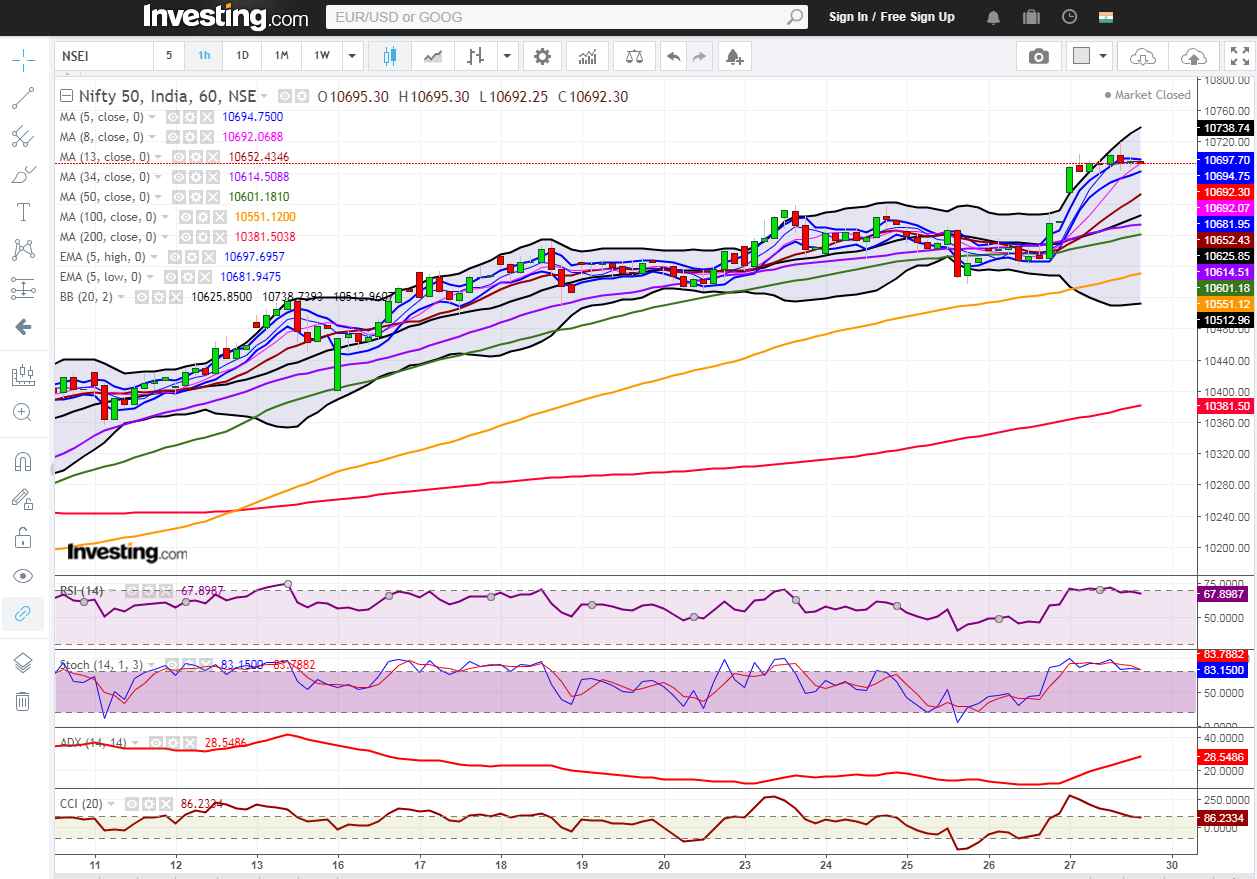
Hourly chart
Daily Technical
In the daily chart, Nifty is trading above 5 day High EMA and also above most moving average suggesting upside momentum. Moreover, Nifty broke out of the congestion area of 10600 with good volume suggesting positive outlook in the daily chart.
The probable support in the daily chart comes at 8 Day SMA (presently at approx. 10592) and 5 Day Low EMA (presently at approx. 10577).
On the upside, Nifty may face resistance at upper Bollinger band (presently at approx. 10754). Daily RSI is trading close to the upper bound while Stochastic and CCI are very close to the upper bound of their respective range suggesting strength in the daily time frame. Overall, Nifty appears strong in the Daily chart.
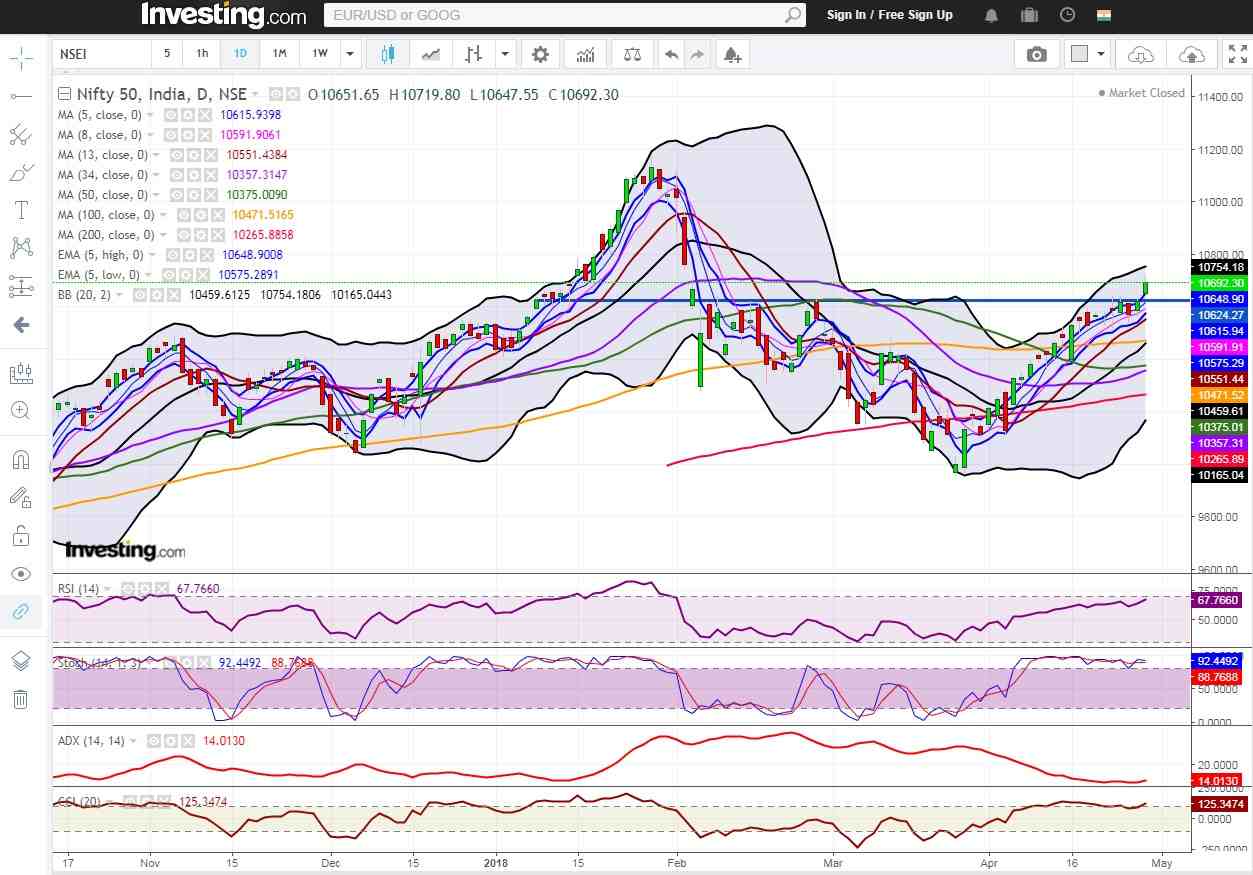
Daily chart
Weekly Technical
Nifty has given a positive close for the fifth consecutive week which suggests that bulls are in full control. Moreover, the close above 5 week high EMA also indicates that the upside momentum is likely to continue.
The Karnataka election which is going to take place after two weeks will play a key role in deciding the direction of Nifty going forward but as of now, the Index is expected to maintain positive bias. Weekly CCI, RSI and Stochastic are in the normal zone. Overall, Nifty remained positive to neutral in the weekly chart.
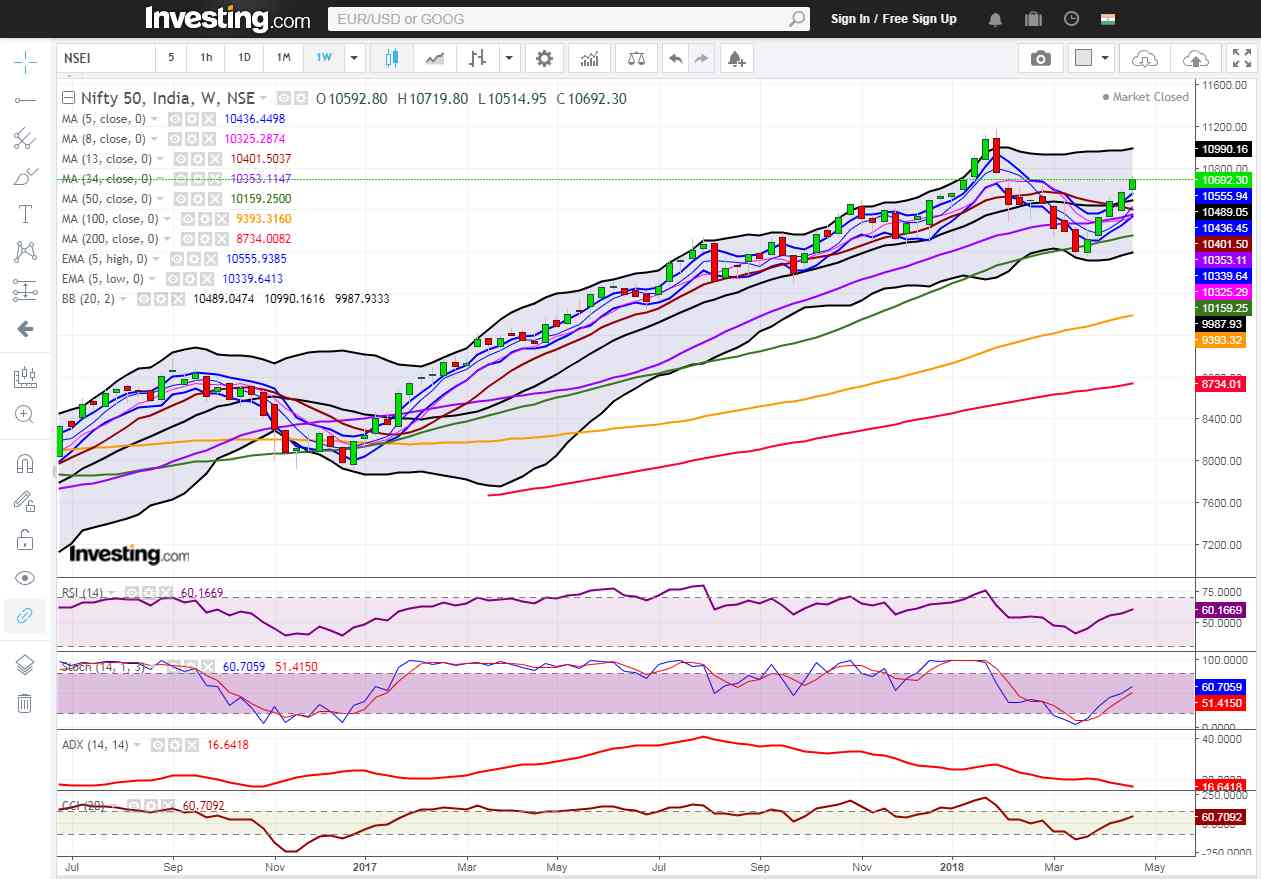
Weekly chart
You can use stockedge app to get cutting edge over others in both short term trading and investing. Here you not only get data at one particular place but can also create your own combination scans based on your own technical and fundamental parameter. See the video below to know about various features in Stocedge app.
https://www.youtube.com/watch?v=uqz4PVw0blw
Nifty ELM matrix




Thank you for this post. Its very inspiring.
Welcome