The market in general has been falling since March 2015, however MARUTI started buckling only recently, from the end of December 2015.
If we look at the chart of MARUTI, we can see a clear indication of a topping out, which could have served a very good warning to the investors to exit before the the stock started bleeding red.

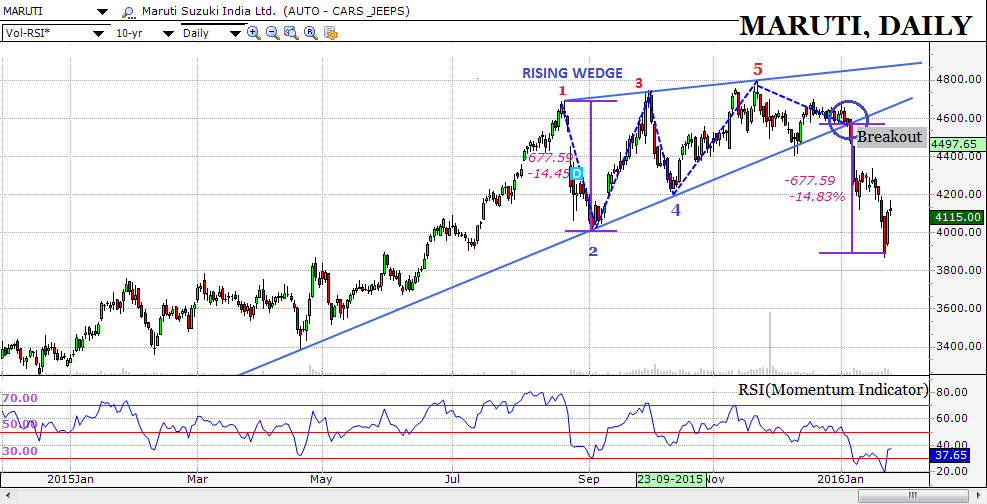
On the chart of MARUTI we see the formation of the ‘Rising Wedge’ pattern. The name of the pattern comes from the fact that both the upward bounding resistance trendline and the lower bounding support trendline are angled upwards and appear to be ‘Rising’. Within the bounds a lot of activity is witnessed, with the prices bouncing off from the bounding lines several times before finally breaking out in a particular direction. The Rising Wedge is predominantly a reversal pattern. If it appears after an uptrend, like in this case, it gives a downside breakout, thus ending in a reversal of the price trend. A rising wedge can also occur in a downtrend, as a counter trend movement and ends up with again a downside breakout thereby resulting in a continuation of the main trend.
On the daily chart of MARUTI, the Rising Wedge pattern developed successfully, registering 5 contact points and finally breaking below the supporting line. The target level post such breakout is the base of the wedge , that is the length of the first wave, which in this case is ~677 points as marked by the violet price line. On the chart, we see that MARUTI has very well achieved this target level , taken support at the same, and bounced upward.
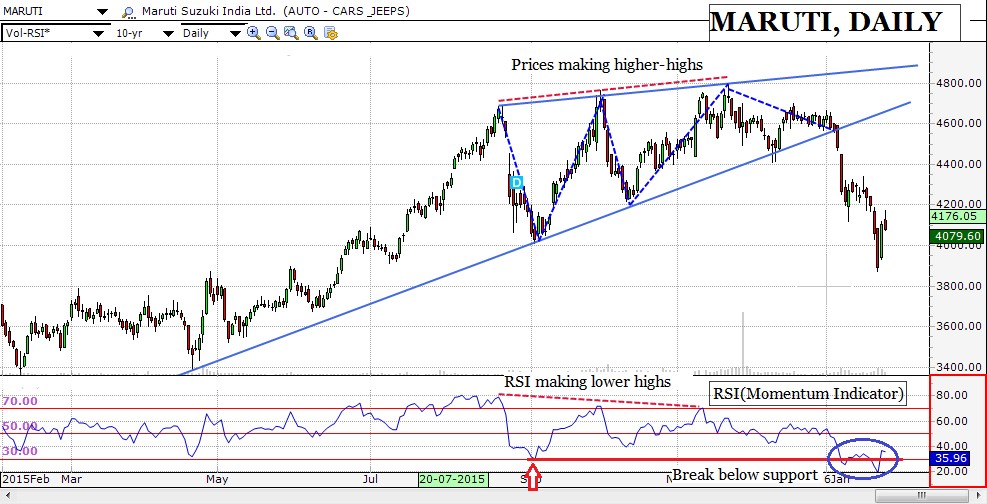
Other than the presence of the chart pattern, the momentum indicator, RSI had also hinted about the formation of a top.

In the above chart we can see that the price of MARUTI had registered higher peaks consecutively, or ‘higher-highs’ , however on the RSI indicator, lower consecutive peaks , or ‘lower-highs’, were seen forming. This is called a ‘Negative Divergence’ which indicates the weakening of underlying upside momentum and is often a cause of worry. Post the breakout also, we saw the RSI tumbling very fast, thus emphasizing the weakness in the price of MARUTI’s stock. It also broke below previous support and the important zone of 30.
We appreciate your interest in learning about the financial market. Do leave your comments and valuable feedback below in the comments section.
DISCLAIMER: This article is written purely for educational purpose and does not intend the disbursement of any trading or investment tip. Kindly consult your financial advisory before investing as it may result in a loss of capital.


