At the end of the first week of the FY 16-17 we saw the index Nifty ending the day with a gain of mere 11 points from yesterday, but on a weekly basis it has lost over 200 points slipping from the resistance of 7550 down to the support of 7550. The question here is will this trend continue? The answer lies in patience. The movement of Monday will be the deciding factor for the coming days. If nifty manages to bounce up from here then we can expect some strength to return however if the index slips further below then the level of 7400 is not very far as the next support.
On the weekly chart we can see that Nifty has attained the 23.60% retracement to it previous rally and if this correction continues then the next support will be 7400 which is also the 38.2% retracement zone.
Among the other indices we see that Nifty Realty and Nifyt infra have been the gainer today whereas Nifty IT has lost the most.
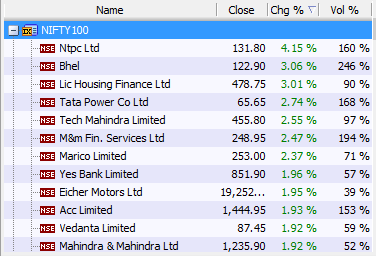
On the gainers end we have:

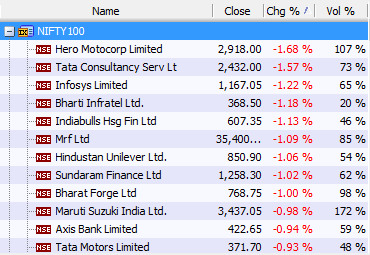
On the losers end we have:

The international picture:
Crude oil is trading with considerable strength as we speak , almost 3,50% higher whereas gold and silver are relatively flat with negativity. The DOW and NASDAQ futures are also showing strength , hinting towards good performance for the index when they open tonight. Yesterday we can see the Dow and NASDAQ indices lost almost a percent in trade.
The European indices are also trading positive with gains of almost a percent today owing to the gains in crude oil.
The Asian indices have given mixed signals, Japan’s Nikkei and Hangseng have closed positive whereas China’s Shanghai has closed negative, Indian indices have closed flat.
CHART OF THE DAY
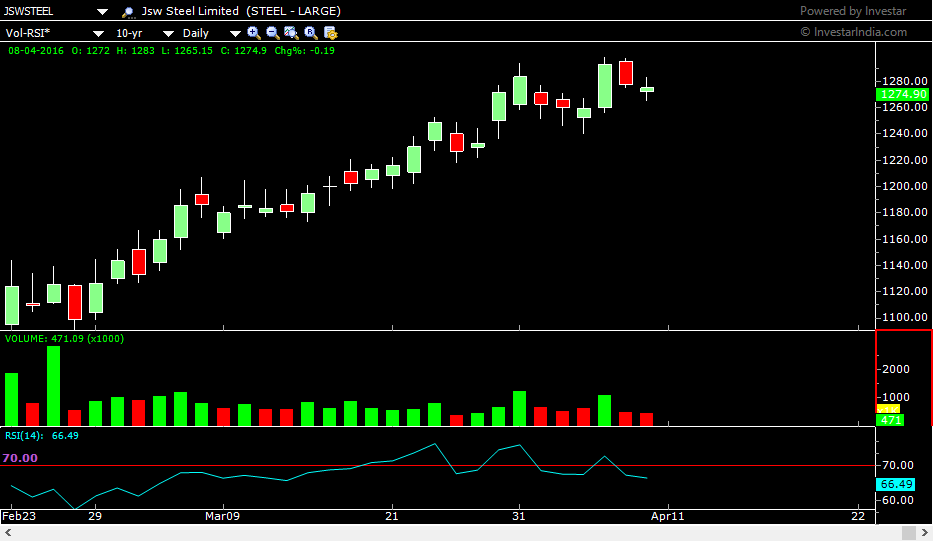
On the month chart of JSWsteel we can see that the life time high is not very far. It is currently trading at 1275 which is just 100 points off the high of 1368 which has acted as a strong resistance and has stopped the stock in 3 ascends in the past. On the daily chart of the stock we can see that the price ans RSI are forming a Negative divergence, that is the price is forming a higher high whereas the RSI is forming the lower high which is an indication of the stock losing steam.Therefore we can say that the remaining 100 points of upside hinted by the monthly chart can be the maximum this stock will see for a while. There after some consolidation of correction may follow here.
in the chart of Nifty also we see that the signals are not particularly bullish and one sided. that combined with this skeptic signals from beta stocks might be an indication of weakness or choppy movement to prevail the market in the week to come.

________________________________________________________________________________________________________________________________________
Read more articles here:
http://blog.elearnmarkets.com/market/nifty-chart/


