Elearnmarkets - Financial Market Learning
  • Categories
    • Basic Finance
    • Derivatives
    • Financial Planning
    • Fundamental Analysis
    • Technical Analysis
    • Marketshala
    • Miscellaneous
  • Language
    • English
    • Hindi
    • Bengali
No Result
View All Result
  • Courses
  • Webinars
  • Learn On Elearnmarkets
Elearnmarkets - Learn Stock Market, trading, investing for Free
No Result
View All Result
Home Technical Analysis Market Analysis Charts
Infosys

Infosys (INFY) Breakout Supports The Market Today !

Elearnmarkets by Elearnmarkets
November 18, 2020
in Charts, Market Analysis
Reading Time: 2 mins read
3
101
VIEWS
Share on FacebookShare on TwitterShare on WhatsApp

INFOSYS, DAILY:

Infosys is one of the most beloved stock in Nifty that trades on the exchange. Amazing patterns and mind-blowing confirmations are a common thing on this stock’s chart. Today, following the announcement of its Third Quarter result, it has given a very sharp move on the upside. Let’s look at the charts and dissect this movement, identifying signs which hinted towards it.

We will study the following phenomenon on the daily chart of INFOSYS :

  • Resistance on trendline – leading to downturn in prices
  • Support on trendline – leading to upturn in prices
  • Moving average breakout- effective signal of trend change
INFOSYS BREAKOUT
INFOSYS , DAILY

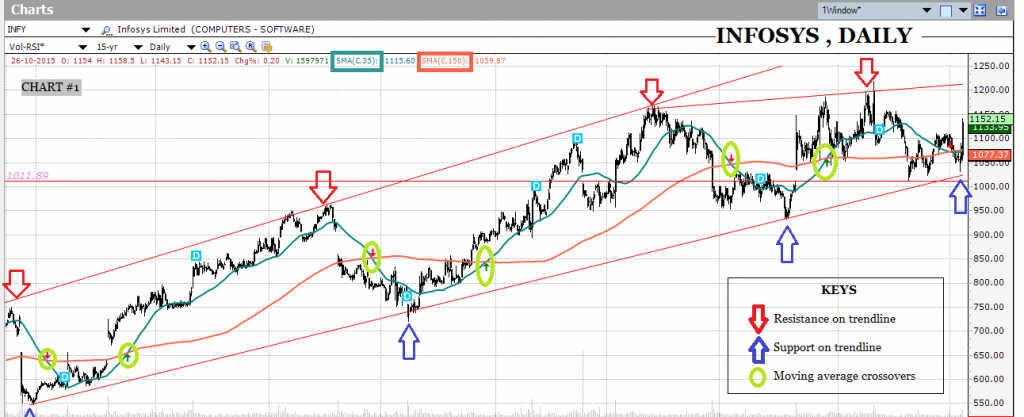
In Chart # 1, the blue arrows are marking the points where Infosys has bounced back sharply making new highs, whereas the red arrows are marking the points where Infosys has halted its advance and made higher low, as are customary in an uptrend. According to Dow Theory, this sequence of higher-highs and higher-lows are components of an uptrend and as long as this keeps happening, the trend is considered intact. Also plotted on the charts are two simple moving averages (SMA): 35-day and 150-day.

Moving averages, as the name suggests, are the average of the stock’s closing price for a specified period.  The crossover in two SMAs is a trend change signal more often than not. On the chart of Infosys, the green circles highlight the crossovers between the 35 day SMA and the 150 day SMA.

INFOSYS BREAKOUT FROM MOVING AVERAGE AND BOUNCE FROM TRENDLINE
INFOSYS, DAILY (CLOSE UP )

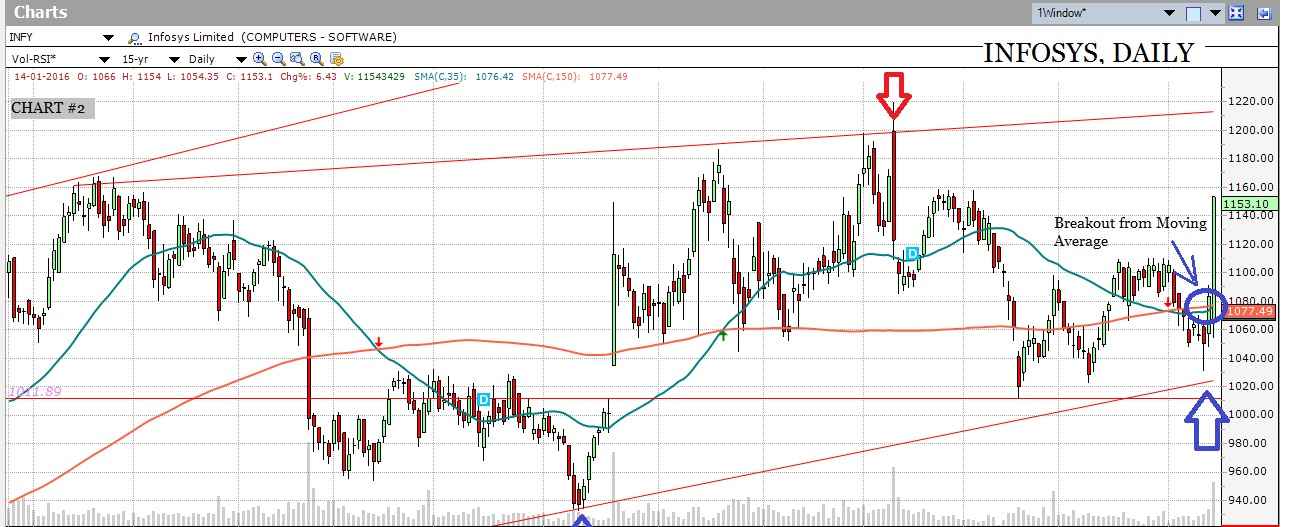
Now if we zoom into today’s movement and look at Chart # 2, there are two points we need to focus upon:

1)      On 12th January, Infosys had taken support on the lower trendline and ;

2)      The next day it gave a closing above the 35 day SMA and 150 day SMA together.

Such phenomenal signals and confirmations are rare to observe. This is a text-book-perfect example of the strength of a trendline in supporting falling prices and the importance of a moving average in marking out opportunities on days when prices ‘close’ above them.

Lastly, given the chart development and the phenomenal response to trendlines, naturally 1220 becomes the next resistance zone to look out for in the days to come.

Do you know how to read charts and patterns? Check out for NSE Academy Certified Technical Analysis course on Elearnmarkets.

Tags: english
ShareTweetSend
Previous Post

10 ways to distinguish a fake 500 rupee note

Next Post

Market Wrap: 14 January 2016

Elearnmarkets

Elearnmarkets

Elearnmarkets (ELM) is a complete financial market portal where the market experts have taken the onus to spread financial education. ELM constantly experiments with new education methodologies and technologies to make financial education effective, affordable and accessible to all. You can connect with us on Twitter @elearnmarkets.

Related Posts

Hourly Chart
Market Analysis

Nifty Ends on Positive Note, Gains Approx. 475 Points on Positive Global Factors

November 18, 2020
378
Weekly Chart
Market Analysis

Huge Sell-Off Makes the Market Close in a Negative Note on the Expiry Week

November 18, 2020
175
Hourly Chart
Market Analysis

Nifty Ends in Green. Rupee Appreciates and Falling Crude Price Helped the Market to Recover Approx. 140 Point

November 18, 2020
129
Hourly Chart
Market Analysis

Sell Off Continues. Nifty Ends The Week With Three Consecutive Red Candles

November 18, 2020
141

Comments 3

  1. verthilertva says:
    3 years ago

    Good day! I just wish to give a huge thumbs up for the good info you will have right here on this post. I can be coming again to your weblog for extra soon.

    Reply
  2. froleprotrem says:
    3 years ago

    I am constantly looking online for articles that can help me. Thank you!

    Reply
  3. froleprotrem says:
    3 years ago

    Some truly nice and useful info on this site, also I think the style holds fantastic features.

    Reply

Leave a Reply Cancel reply

Your email address will not be published. Required fields are marked *

Follow Us

Facebook-f Twitter Instagram Linkedin-in Youtube Telegram

Register on Elearnmarkets

Continue your financial learning by creating your own account on Elearnmarkets.com

Register Free Account

Download App

Categories

  • Basic Finance
  • Derivatives
  • Financial Planning
  • Fundamental Analysis
  • Technical Analysis
  • Marketshala
  • Miscellaneous

Popular On Elearnmarkets

  • Market Superheroes:
  • Vivek Bajaj
  • Chetan Panchamia
  • Ashish Kyal
  • Premal Parekh
  • Abhijit Paul
  • Jegan
  • Sivakumar Jayachadran
  • Vishal Malkan
  • Jyoti Budhia
  • Vivek Gadodia
  • Vishal Mehta
  • Piyush Chaudhry
  • Santosh Pasi
  • Gomathi Shankar
  • Market Superheroes:
  • Vivek Bajaj
  • Chetan Panchamia
  • Ashish Kyal
  • Premal Parekh
  • Abhijit Paul
  • Jegan
  • Sivakumar Jayachadran
  • Vishal Malkan
  • Jyoti Budhia
  • Vivek Gadodia
  • Vishal Mehta
  • Piyush Chaudhry
  • Santosh Pasi
  • Gomathi Shankar
  • Courses:​
  • Options Trading
  • Dow Theory
  • Momentum Trading
  • Stock Investing
  • Stock Market for Beginners
  • Harmonic Chart Patterns
  • Algo Trading
  • Elliot Wave Theory
  • Advanced Excel
  • Cryptocurrency
  • NSE Certification Course
  • Courses:​
  • Options Trading
  • Dow Theory
  • Momentum Trading
  • Stock Investing
  • Stock Market for Beginners
  • Harmonic Chart Patterns
  • Algo Trading
  • Elliot Wave Theory
  • Advanced Excel
  • Cryptocurrency
  • NSE Certification Course
  • Webinars:
  • Bank Nifty Scalping
  • Intraday Trading Strategies
  • Options Trading Strategies
  • Options selling
  • Price Action
  • Relative Strength
  • Tax Planning
  • Options Buying
  • Growth Stocks
  • Portfolio Management
  • Relative Strength Index
  • Risk Management
  • Renko Charts
  • Crude Oil
  • Traders Psychology
  • Moving Average
  • Multibagger Stocks
  • Free Learning Modules:
  • Intraday Trading
  • Options Scalping
  • Swing Trading
  • Financial Modelling
  • RSI Indicator
  • Bollinger Bands
  • Pricing of Futures
  • Personal Finance
  • Initial Public Offerings (IPO)
  • Value Investing
  • Technical Indicators
  • Candlesticks
  • Chart Patterns
  • Option Greeks
  • ELSS Funds
  • Banking and Insurance
  • Real Estate
  • Gold
  • Book Summaries:
  • Rich Dad Poor Dad
  • Psychology of Money
  • The Intelligent Investor
  • The Richest Man in Babylon
  • Think and Trade Like a Champion
  • Value Investing and Behavioural Finance
  • Trading in the Zone
  • Learn to Earn
  • Book Summaries:
  • Rich Dad Poor Dad
  • Psychology of Money
  • The Intelligent Investor
  • The Richest Man in Babylon
  • Think and Trade Like a Champion
  • Value Investing and Behavioural Finance
  • Trading in the Zone
  • Learn to Earn
  • Tools:
  • CAGR Calculator
  • SIP Calculator
  • eLearnOptions
  • Future Value Calculator
  • Present Value Calculator
  • Atal Pension Yojana
  • Cost of Delay Calculator
  • Become a Crorepati
  • Tools:
  • CAGR Calculator
  • SIP Calculator
  • eLearnOptions
  • Future Value Calculator
  • Present Value Calculator
  • Atal Pension Yojana
  • Cost of Delay Calculator
  • Become a Crorepati

© 2023 Elearnmarkets. All Rights Reserved

  • Visit Elearnmarkets
  • Courses
  • Webinars
  • Financial Guides
  • Get Free Counselling
  • Visit Elearnmarkets
  • Courses
  • Webinars
  • Financial Guides
  • Get Free Counselling

Get Elearnmarkets App

No Result
View All Result
  • Article Categories
    • Basic Finance
    • Derivatives
    • Financial Planning
    • Fundamental Analysis
    • Technical Analysis
    • Marketshala
    • Miscellaneous
  • Language
    • Hindi
    • Bengali
    • English
  • Courses
  • Webinars

© 2020 Elearnmarkets All Rights Reserved

Suggested Learning

Technical Analysis Made Easy

Certification in Online Technical Analysis

Online NSE Academy Certified Capital Market Professional (E-NCCMP)