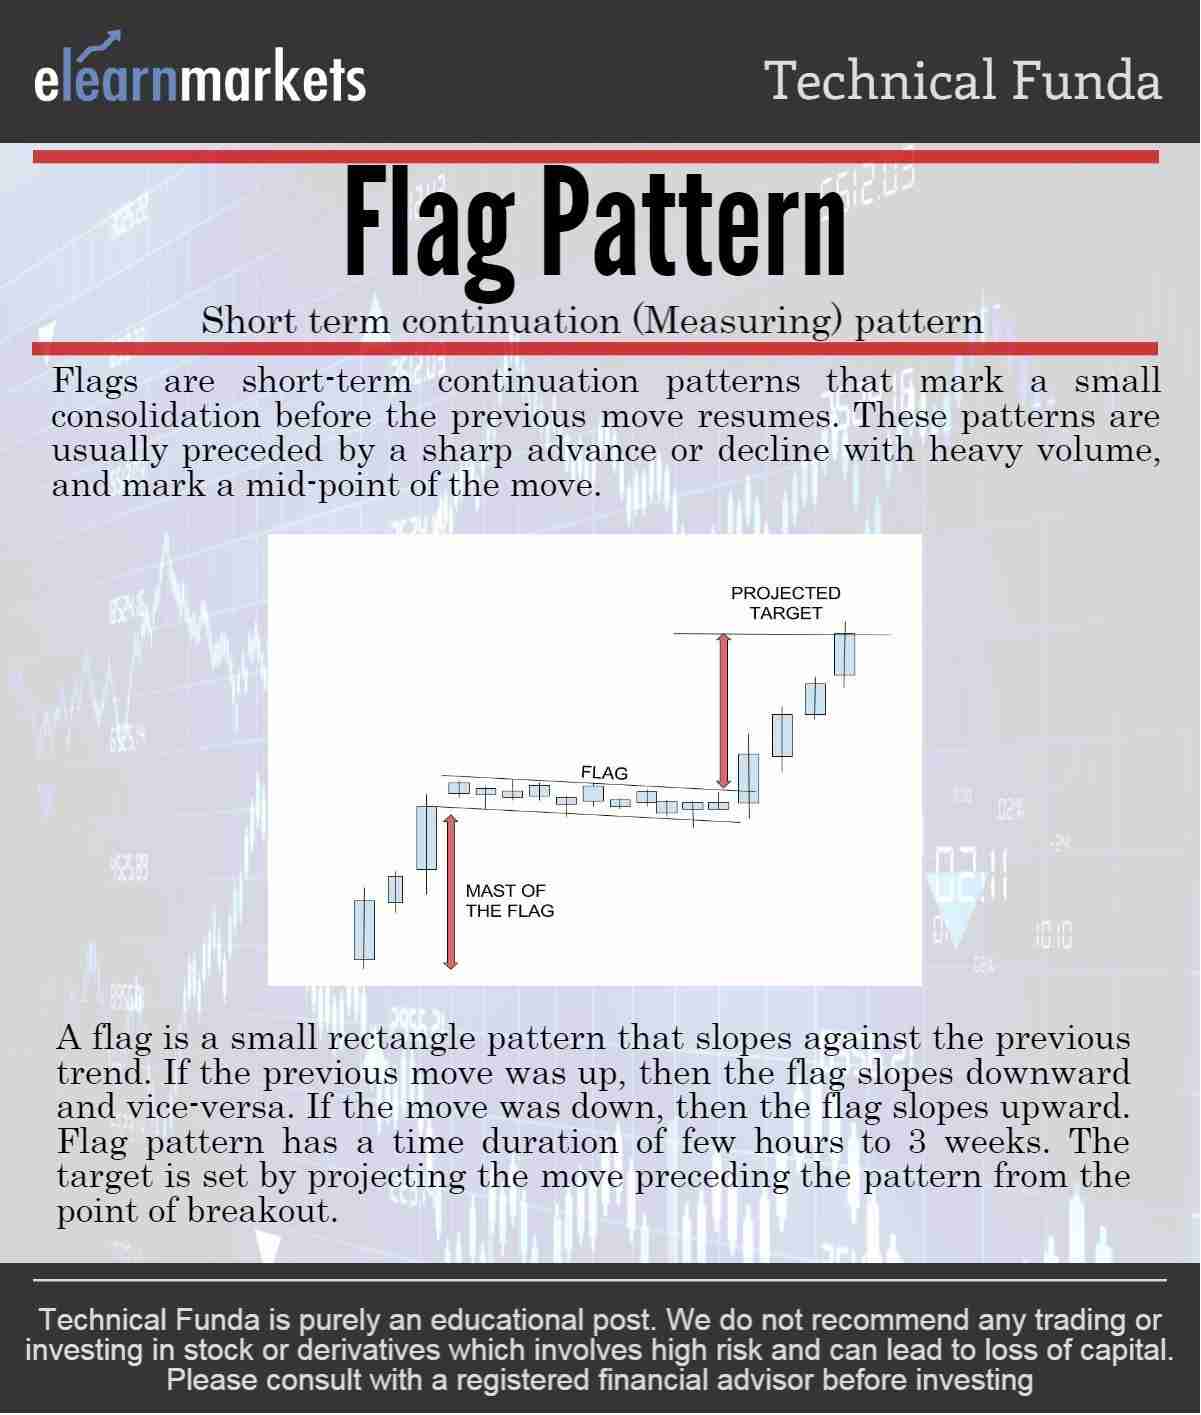
Elearnmarkets - Financial Market Learning
  • Categories
    • Basic Finance
    • Derivatives
    • Financial Planning
    • Fundamental Analysis
    • Technical Analysis
    • Marketshala
    • Miscellaneous
  • Language
    • English
    • Hindi
    • Bengali
No Result
View All Result
  • Courses
  • Webinars
  • Learn On Elearnmarkets
Elearnmarkets - Learn Stock Market, trading, investing for Free
No Result
View All Result
Home Technical Analysis Market Analysis Charts

IFCI set to fly high with a classic Flag Pattern in chart!

Elearnmarkets by Elearnmarkets
December 9, 2021
in Charts, Market Analysis
Reading Time: 3 mins read
0
290
VIEWS
Share on FacebookShare on TwitterShare on WhatsApp

A Flag Pattern may be formeflagd after a downtrend or an uptrend.

Also Read: A complete overview on trend and theory of retracement

It is a measuring move, as it occurs somewhere near the middle of the trend.

Post the formation of a Flag pattern, the price advance or decline by almost exactly the same magnitude as it had before the formation of the Flag.

Enroll for NSE Academy Certified Technical Analysis learning and a better understanding of charts & patterns.

The flag is like a rectangular consolidation phase with a slight tilt in the direction opposite to the preceding trend.

Flag Pattern is like a short-term rectangle pattern, a similar pattern is the pennant pattern which is a triangular short-term pattern and is also a measuring pattern.

The volumes play a very important role in the formation of Flag, during the consolidation phase, the volumes gradually decrease and burst on the breakout.

Examples:

An example of the Flag Pattern is present below, in the chart of JUSTDIAL LTD..

FLAG PATTERN ON THE DAILY CHART OF JUSTDIAL

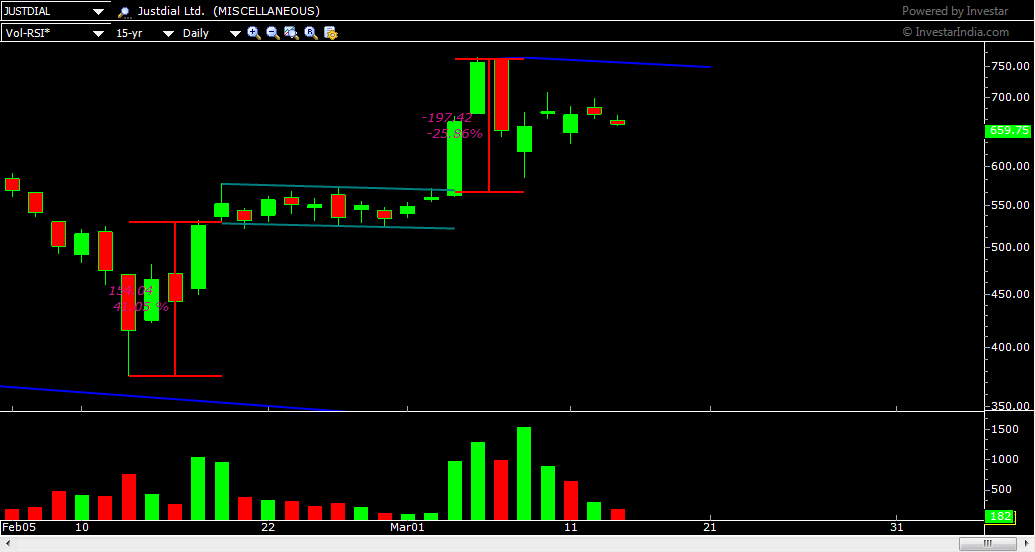
The above is a historical example.

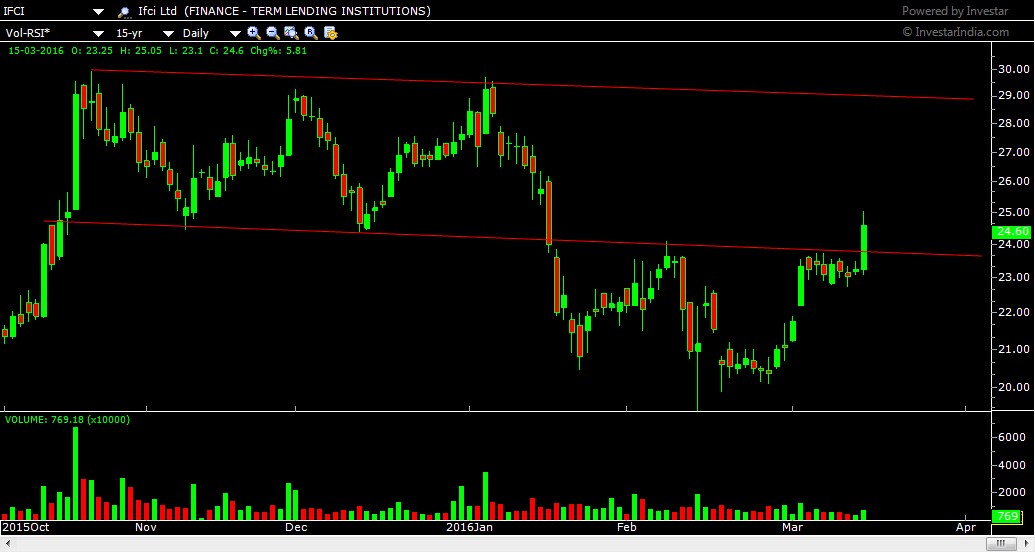
Below, we have an example of the flag pattern as it unfolds.

The chart of IFCI Ltd has given a breakout from the rectangle consolidation pattern and is heading higher.

The target from the low of 20.10 upto the base of the rectangle pattern, i.e 22.8o is 22.80-21.10=1.70.

ifci flag pattern 1

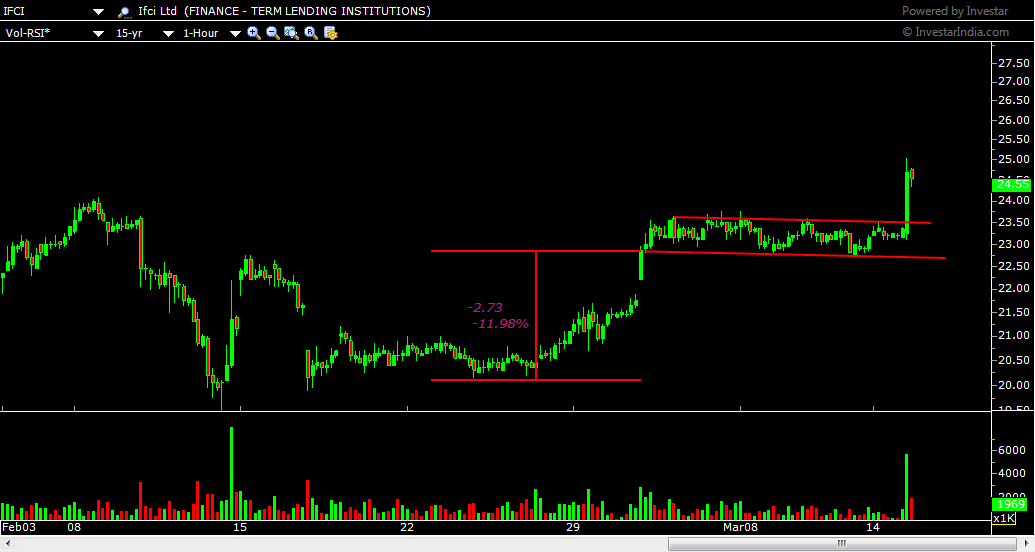
Projecting the same from the point of breakout i.e 23.50 gives us 23.50+1.70= 25.20


INFOGRAPH ON FLAG PATTERN

You can check Nifty Charts for more Charts and Pattern

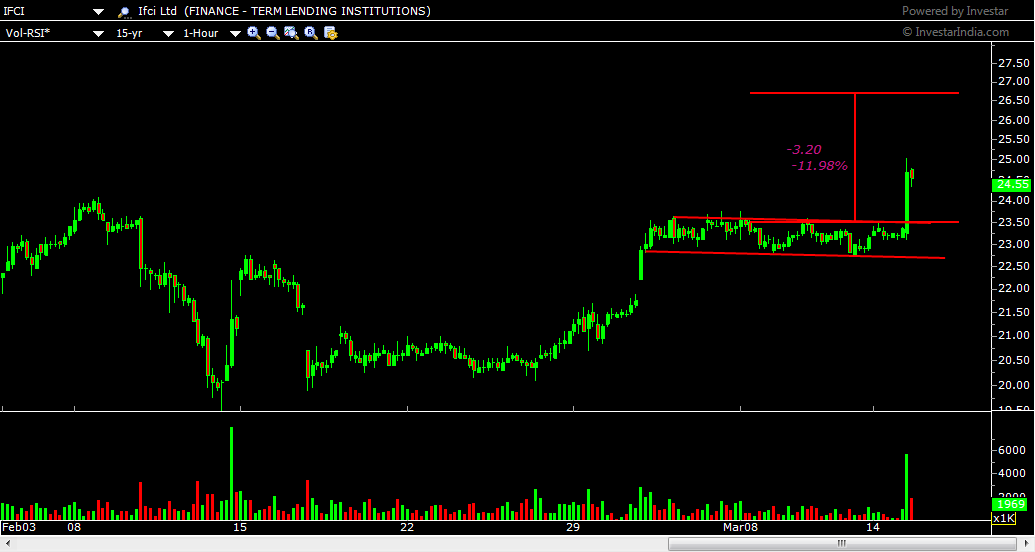
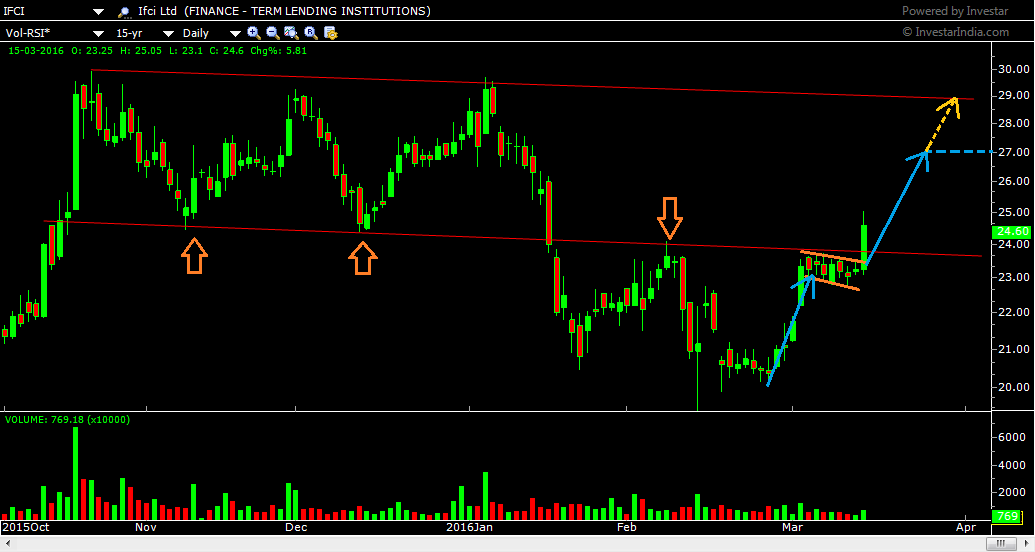
On the daily chart of IFCI Ltd below, we see that the Flag Pattern has emerged at the point of a resistance trendline.

Following that, the breakout which occurred today has taken the stock not just out of the bounds of the flag pattern but also above the important resistance zone of 23.50.

As per this pattern, we have already determined the level of 27.20 as achievable, however as per the trendline visible on the chart we can estimate that the stock might take a second resistance at that level of 29.

Therefore the coming major zones of resistance for IFCI Ltd are 27.20 and 29.

Read More: A comprehensive study on Support and Resistance

IFCI ltd daily chart showing support and resistance zopnes also the flsg pattern
IFCI ltd daily chart showing support and resistance zones also the flag pattern

Bottomline:

With this, we have come to the end of the article.

Do leave your comments and doubts in the comments section below, we will surely get back to you.


In order to get the latest updates on Financial Markets visit Stockedge

Tags: englishFlag Patternifci
ShareTweetSend
Previous Post

Loan EMI Calculation – Smart Ways to calculate EMI easily

Next Post

Market Wrap for 15th march, ’16: Nifty gives up to 7550, down 1%, midcaps drag.

Elearnmarkets

Elearnmarkets

Elearnmarkets (ELM) is a complete financial market portal where the market experts have taken the onus to spread financial education. ELM constantly experiments with new education methodologies and technologies to make financial education effective, affordable and accessible to all. You can connect with us on Twitter @elearnmarkets.

Related Posts

Hourly Chart
Market Analysis

Nifty Ends on Positive Note, Gains Approx. 475 Points on Positive Global Factors

November 18, 2020
378
Weekly Chart
Market Analysis

Huge Sell-Off Makes the Market Close in a Negative Note on the Expiry Week

November 18, 2020
175
Hourly Chart
Market Analysis

Nifty Ends in Green. Rupee Appreciates and Falling Crude Price Helped the Market to Recover Approx. 140 Point

November 18, 2020
129
Hourly Chart
Market Analysis

Sell Off Continues. Nifty Ends The Week With Three Consecutive Red Candles

November 18, 2020
141

Leave a Reply Cancel reply

Your email address will not be published. Required fields are marked *

Follow Us

Facebook-f Twitter Instagram Linkedin-in Youtube Telegram

Register on Elearnmarkets

Continue your financial learning by creating your own account on Elearnmarkets.com

Register Free Account

Download App

Categories

  • Basic Finance
  • Derivatives
  • Financial Planning
  • Fundamental Analysis
  • Technical Analysis
  • Marketshala
  • Miscellaneous

Popular On Elearnmarkets

  • Market Superheroes:
  • Vivek Bajaj
  • Chetan Panchamia
  • Ashish Kyal
  • Premal Parekh
  • Abhijit Paul
  • Jegan
  • Sivakumar Jayachadran
  • Vishal Malkan
  • Jyoti Budhia
  • Vivek Gadodia
  • Vishal Mehta
  • Piyush Chaudhry
  • Santosh Pasi
  • Gomathi Shankar
  • Market Superheroes:
  • Vivek Bajaj
  • Chetan Panchamia
  • Ashish Kyal
  • Premal Parekh
  • Abhijit Paul
  • Jegan
  • Sivakumar Jayachadran
  • Vishal Malkan
  • Jyoti Budhia
  • Vivek Gadodia
  • Vishal Mehta
  • Piyush Chaudhry
  • Santosh Pasi
  • Gomathi Shankar
  • Courses:​
  • Options Trading
  • Dow Theory
  • Momentum Trading
  • Stock Investing
  • Stock Market for Beginners
  • Harmonic Chart Patterns
  • Algo Trading
  • Elliot Wave Theory
  • Advanced Excel
  • Cryptocurrency
  • NSE Certification Course
  • Courses:​
  • Options Trading
  • Dow Theory
  • Momentum Trading
  • Stock Investing
  • Stock Market for Beginners
  • Harmonic Chart Patterns
  • Algo Trading
  • Elliot Wave Theory
  • Advanced Excel
  • Cryptocurrency
  • NSE Certification Course
  • Webinars:
  • Bank Nifty Scalping
  • Intraday Trading Strategies
  • Options Trading Strategies
  • Options selling
  • Price Action
  • Relative Strength
  • Tax Planning
  • Options Buying
  • Growth Stocks
  • Portfolio Management
  • Relative Strength Index
  • Risk Management
  • Renko Charts
  • Crude Oil
  • Traders Psychology
  • Moving Average
  • Multibagger Stocks
  • Free Learning Modules:
  • Intraday Trading
  • Options Scalping
  • Swing Trading
  • Financial Modelling
  • RSI Indicator
  • Bollinger Bands
  • Pricing of Futures
  • Personal Finance
  • Initial Public Offerings (IPO)
  • Value Investing
  • Technical Indicators
  • Candlesticks
  • Chart Patterns
  • Option Greeks
  • ELSS Funds
  • Banking and Insurance
  • Real Estate
  • Gold
  • Book Summaries:
  • Rich Dad Poor Dad
  • Psychology of Money
  • The Intelligent Investor
  • The Richest Man in Babylon
  • Think and Trade Like a Champion
  • Value Investing and Behavioural Finance
  • Trading in the Zone
  • Learn to Earn
  • Book Summaries:
  • Rich Dad Poor Dad
  • Psychology of Money
  • The Intelligent Investor
  • The Richest Man in Babylon
  • Think and Trade Like a Champion
  • Value Investing and Behavioural Finance
  • Trading in the Zone
  • Learn to Earn
  • Tools:
  • CAGR Calculator
  • SIP Calculator
  • eLearnOptions
  • Future Value Calculator
  • Present Value Calculator
  • Atal Pension Yojana
  • Cost of Delay Calculator
  • Become a Crorepati
  • Tools:
  • CAGR Calculator
  • SIP Calculator
  • eLearnOptions
  • Future Value Calculator
  • Present Value Calculator
  • Atal Pension Yojana
  • Cost of Delay Calculator
  • Become a Crorepati

© 2023 Elearnmarkets. All Rights Reserved

  • Visit Elearnmarkets
  • Courses
  • Webinars
  • Financial Guides
  • Get Free Counselling
  • Visit Elearnmarkets
  • Courses
  • Webinars
  • Financial Guides
  • Get Free Counselling

Get Elearnmarkets App

No Result
View All Result
  • Article Categories
    • Basic Finance
    • Derivatives
    • Financial Planning
    • Fundamental Analysis
    • Technical Analysis
    • Marketshala
    • Miscellaneous
  • Language
    • Hindi
    • Bengali
    • English
  • Courses
  • Webinars

© 2020 Elearnmarkets All Rights Reserved

Suggested Learning

Technical Analysis Made Easy

Certification in Online Technical Analysis

Online NSE Academy Certified Capital Market Professional (E-NCCMP)