Elearnmarkets - Financial Market Learning
  • Categories
    • Basic Finance
    • Derivatives
      • Futures
      • Options
    • Financial Planning
    • Fundamental Analysis
    • Technical Analysis
    • Marketshala
    • Miscellaneous
  • Language
    • English
    • Hindi
    • Bengali
No Result
View All Result
  • Courses
  • Webinars
  • Stories
Elearnmarkets - Learn Stock Market, trading, investing for Free
No Result
View All Result
Home Technical Analysis
Mastering Inside Bar Trading Strategy

Mastering Inside Bar Trading Strategy

Elearnmarkets by Elearnmarkets
August 23, 2023
in Technical Analysis, Charts, Patterns & Indicators
Reading Time: 5 mins read
3
10.7k
VIEWS
Share on FacebookShare on XShare on WhatsApp

Today we will discuss a very powerful candlestick formation known as Inside Bar pattern which is basically two-bar price action strategy. Here we will discuss the structure of the inside bar setup, the psychology behind it and some inside bar trading strategies when to enter or avoid the trade.

Table of Contents
What is an Inside Bar?
Psychology behind the Inside Bar
When to enter the trade and when to avoid the trade?
5 important characteristics of Inside Bar that matters
How to trade?

What is an Inside Bar?

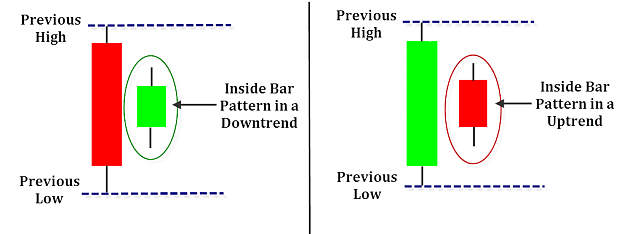
An Inside Bar pattern is a two-bar price action trading strategy where the inside bar is smaller and within the high-low range of the previous bar (popularly known as mother bar).

The relative position of the inside bar can be present at the bottom, middle or top of the inside bar.

Psychology behind the Inside Bar

Inside Bar pattern basically shows a period of indecision or consolidation in the market.

This is usually formed following a strong move in the market as it pauses to consolidate before making its next move.

However, they can also form at a market turning points and acts as a reversal signal from key support or resistance.

Also Read: A comprehensive study on Support and Resistance

inside bar trading pattern

RelatedPosts

All 35 Candlestick Chart Patterns in the Stock Market-Explained 1

All 35 Candlestick Chart Patterns in the Stock Market-Explained

November 27, 2023
2.1M
Super Successful Techno Funda Stock Market Strategy 2

Super Successful Techno Funda Stock Market Strategy

November 28, 2023
1.3k
5 Most Used Swing Trading Indicators 3

5 Most Used Swing Trading Indicators

November 28, 2023
57k

These are actually low volatility ranges and the subsequent course of action will be highly volatile which creates a good swing trading opportunity.

So the high and low of the mother bar basically acts as a short-term support or resistance.

Keep Inside Bar’s opposite direction to be the stop loss.

When to enter the trade and when to avoid the trade?

When you notice an Inside Candle on the price chart, you should mark the high and low of the Inside Bar consolidation range.

Both the levels are used as a trigger of a potential trade as there is a high possibility of continuation outside the range in the direction the breakout.

Though prior to the actual move, there is no clarity of the direction of the breakout.

In simple words, you should go long if the price breaks on the upside while you should go short if the breakout is on the downside.

Learn from Experts: Identify Trend Reversal with Candlesticks

Taking position based on inside candle is ideal in case of breakout or the market is trending.

In case of a consolidation or a choppy phase, you should avoid taking a position.

5 important characteristics of Inside Bar that matters

a. The time frame is important

The time frame is a key in case you trade based on inside bar.

You should not enter into a trade based on this strategy with anything less than the daily time frame.

The reason being that there will be high chances of false signals as lower time frame trades are more influenced by noise.

b. Works beautifully in trending market

If you are planning to trade based on inside candle, then you should always look for a trend.

Also Read: A complete overview on trend and theory of retracement

This strategy does not work in a choppy market as you will be easily stopped out.

c. Look for a breakout

The best inside bar setups takes place just after a break from a consolidation phase where the preceding trend is set to resume.

d. Give priority to the risk-reward ratio

A favourable risk to reward ratio is a key to the success of any trading setup.

The best thing about Inside Bar trading strategy is that risk is very limited as compared to the subsequent movement.

e. Size of inside bar

The size of the inside bar vis-a-vis mother bar is extremely important.

The smaller the inside bar relative to the mother bar, the higher the chance of experiencing a profitable trade setup.

Also Read: Trade RSI using the Andrew Cardwell way

The formation of inside bar from within the upper or lower half of the mother bar is an ideal situation.

How to trade?

1. Market breaks out of consolidation

You should avoid trading inside candle when the particular stock is range bound.

The best time to trade is when the stock comes out of the choppy phase as it is expected that the previous trend is set to resume.

The traders who are unable to devote much time in analysing charts of various securities may benefit from scan section in StockEdge mobile app.

To know how to effectively use the scan of StockEdge mobile app you can watch the video below:

2. Price is respecting 10 periods moving average

The simple technique to filter the trade is by plotting 10 Day Simple Moving Average on the price chart. In case of an up move, you should take a position until the price stays above the 10 Day SMA and vice versa.

Also Read: How to trade using moving average on different timeframes?

3. Inside Bar Breakout with Narrow Range (IB NR4) strategy

The inside bar with narrow range is an inside candle which also has the smallest day range among the last four days.

It indicates that the range is shrinking and anytime there will be a volatility expansion.

Conclusion

Even in a trending market, you will find Inside Bar strategy failing.

There is a candlestick pattern called Hikkake candle pattern which shows the failure of inside bar.

When the inside bar pattern fails and goes back to break the opposite level of the range, within 2-3 bars, we confirm a Hikkake pattern.

Here you can take your position in the opposite direction to the initial Inside Bar trade entry, placing your stop loss on the opposite level of the inside range.

Tags: consolidationenglishInside BarNarrow Range
ShareTweetSend
Get Kotak Offer Get Kotak Offer Get Kotak Offer
Previous Post

Bank Nifty Slips Post Fed’s Hawkish Stance

Next Post

Nifty Below 10k, North Korea Threat Drags

Elearnmarkets

Elearnmarkets

Elearnmarkets (ELM) is a complete financial market portal where the market experts have taken the onus to spread financial education. ELM constantly experiments with new education methodologies and technologies to make financial education effective, affordable and accessible to all. You can connect with us on Twitter @elearnmarkets.

Related Posts

All 35 Candlestick Chart Patterns in the Stock Market-Explained 4
Charts, Patterns & Indicators

All 35 Candlestick Chart Patterns in the Stock Market-Explained

November 27, 2023
2.1M
Super Successful Techno Funda Stock Market Strategy 5
Fundamental Analysis

Super Successful Techno Funda Stock Market Strategy

November 28, 2023
1.3k
5 Most Used Swing Trading Indicators 6
Technical Analysis

5 Most Used Swing Trading Indicators

November 28, 2023
57k
The Ultimate Guide to Swing Trading: Strategies and Tips for Success 7
Technical Analysis

The Ultimate Guide to Swing Trading: Strategies and Tips for Success

November 28, 2023
59.2k

Comments 3

  1. anand says:
    4 years ago

    what is the difference between the harami pattern and inside bar pattern?

    Reply
    • Sakshi Agarwal says:
      4 years ago

      Hi Anand,

      The difference between an inside bar and harami is that with an inside bar, the highs and lows are considered while the real body is ignored.

      Thank you for Reading!

      Keep Reading!

      Reply
  2. frolep rotrem says:
    4 years ago

    Hi there! I simply wish to give a huge thumbs up for the good data you might have right here on this post. I can be coming back to your blog for more soon.

    Reply

Leave a Reply Cancel reply

Your email address will not be published. Required fields are marked *

Elearnmarkets Logo

Follow Us

Facebook-f Twitter Instagram Linkedin-in Youtube Telegram

Register on Elearnmarkets

Continue your financial learning by creating your own account on Elearnmarkets.com

Register Free Account

Download App

Playstore logo
Download on app store

Categories

  • Basic Finance
  • Derivatives
  • Financial Planning
  • Fundamental Analysis
  • Technical Analysis
  • Marketshala
  • Miscellaneous

Popular On Elearnmarkets

  • Market Superheroes:
  • Vivek Bajaj
  • Chetan Panchamia
  • Ashish Kyal
  • Premal Parekh
  • Abhijit Paul
  • Jegan
  • Sivakumar Jayachadran
  • Vishal Malkan
  • Jyoti Budhia
  • Vivek Gadodia
  • Vishal Mehta
  • Piyush Chaudhry
  • Santosh Pasi
  • Gomathi Shankar
  • Market Superheroes:
  • Vivek Bajaj
  • Chetan Panchamia
  • Ashish Kyal
  • Premal Parekh
  • Abhijit Paul
  • Jegan
  • Sivakumar Jayachadran
  • Vishal Malkan
  • Jyoti Budhia
  • Vivek Gadodia
  • Vishal Mehta
  • Piyush Chaudhry
  • Santosh Pasi
  • Gomathi Shankar
  • Courses:​
  • Options Trading
  • Dow Theory
  • Momentum Trading
  • Stock Investing
  • Stock Market for Beginners
  • Harmonic Chart Patterns
  • Algo Trading
  • Elliot Wave Theory
  • Advanced Excel
  • Cryptocurrency
  • NSE Certification Course
  • Courses:​
  • Options Trading
  • Dow Theory
  • Momentum Trading
  • Stock Investing
  • Stock Market for Beginners
  • Harmonic Chart Patterns
  • Algo Trading
  • Elliot Wave Theory
  • Advanced Excel
  • Cryptocurrency
  • NSE Certification Course
  • Webinars:
  • Bank Nifty Scalping
  • Intraday Trading Strategies
  • Options Trading Strategies
  • Options selling
  • Price Action
  • Relative Strength
  • Tax Planning
  • Options Buying
  • Growth Stocks
  • Portfolio Management
  • Relative Strength Index
  • Risk Management
  • Renko Charts
  • Crude Oil
  • Traders Psychology
  • Moving Average
  • Multibagger Stocks
  • Free Learning Modules:
  • Intraday Trading
  • Options Scalping
  • Swing Trading
  • Financial Modelling
  • RSI Indicator
  • Bollinger Bands
  • Pricing of Futures
  • Personal Finance
  • Initial Public Offerings (IPO)
  • Value Investing
  • Technical Indicators
  • Candlesticks
  • Chart Patterns
  • Option Greeks
  • ELSS Funds
  • Banking and Insurance
  • Real Estate
  • Gold
  • Book Summaries:
  • Rich Dad Poor Dad
  • Psychology of Money
  • The Intelligent Investor
  • The Richest Man in Babylon
  • Think and Trade Like a Champion
  • Value Investing and Behavioural Finance
  • Trading in the Zone
  • Learn to Earn
  • Book Summaries:
  • Rich Dad Poor Dad
  • Psychology of Money
  • The Intelligent Investor
  • The Richest Man in Babylon
  • Think and Trade Like a Champion
  • Value Investing and Behavioural Finance
  • Trading in the Zone
  • Learn to Earn
  • Tools:
  • CAGR Calculator
  • SIP Calculator
  • eLearnOptions
  • Future Value Calculator
  • Present Value Calculator
  • Atal Pension Yojana
  • Cost of Delay Calculator
  • Become a Crorepati
  • Tools:
  • CAGR Calculator
  • SIP Calculator
  • eLearnOptions
  • Future Value Calculator
  • Present Value Calculator
  • Atal Pension Yojana
  • Cost of Delay Calculator
  • Become a Crorepati

© 2023 Elearnmarkets. All Rights Reserved

  • Visit Elearnmarkets
  • Courses
  • Webinars
  • Financial Guides
  • Get Free Counselling
  • Visit Elearnmarkets
  • Courses
  • Webinars
  • Financial Guides
  • Get Free Counselling

Get Elearnmarkets App

No Result
View All Result
  • Article Categories
    • Basic Finance
    • Derivatives
    • Financial Planning
    • Fundamental Analysis
    • Technical Analysis
    • Marketshala
    • Miscellaneous
  • Language
    • Hindi
    • Bengali
    • English
  • Courses
  • Webinars
  • Stories

© 2020 Elearnmarkets All Rights Reserved

A Handbook of Technical Analysis
To start your trading journey as a seasoned technical analyst
Download Now
Guidebook On Chart Patterns
Take Your Trading To The Next Level With Strategies Shared In This Ebook
Download Now