Intraday trading mainly refers to buying and selling shares within the day.” As a result, it describes the business activity carried out by an individual during a given day’s market hours.
The main goal of intraday trading is to identify names that may move up or down. When a trader believes a stock will increase, they buy low and sell high.
However, if anticipated a share will decline, a trader is more likely to short-sell, which means sell high and buy low.
Intraday trading requires a keen sense of how the market might act and take appropriate action.
Small-scale traders can now trade markets and strategies previously only available to institutional-grade firms thanks to online brokers’ professional-grade platforms and cost-effective terms and conditions.
One can easily profit from intraday trading, which is one of the main reasons it has become so popular. The strategy’s guiding principles centre on taking advantage of frequent, occasionally slight price changes.
In today’s blog, let us discuss the basics of intraday trading and how to start Intraday Trading:
- What is the Intraday Trading?
- How is Intraday Trading different from trading styles?
- How to do Intraday Trading?
- What are the basic tools for intraday trading indicators?
- How to Develop an Intraday Trading Strategy?
- How to do Risk Management in Intraday Trading?
- Pros and cons of Intraday Trading-
- Frequently Asked Questions (FAQs)
What is the Intraday Trading?
You must go through the laborious process of obtaining physical share certificates to buy or sell shares quickly.
The idea of price movement is the foundation of intraday trading. Shares are purchased at low prices and sold at higher prices. The profit is equal to the difference between the two rates.
For example, on June 16, 2023, shares of Reliance India Ltd. opened at Rs. 2559 and closed at Rs. 2581. During the day, as indicated in the “day’s range” listed to the right of the closing price, shares dropped as low as Rs. 2559 —the intraday low—and hit a peak of Rs. 2586 —the intraday high.
Taking delivery of stocks is one of the main distinctions between intraday trade and regular trade. In intraday trading, regardless of profit or loss, the trader must close out the position the same day before the market closes.
In contrast, depending on the category of the scrip, a trade settlement is made in a few days during regular trading when the trader has the option to remain invested for a while.
Additionally, in intraday trading, the ownership of the shares does not change, whereas delivery results in a change in ownership and the transfer of rights from the seller to the buyer. After settlement, the shares are kept in the Demat account.
Beginners frequently need help selecting the appropriate tools to execute trades and consequently incur losses.
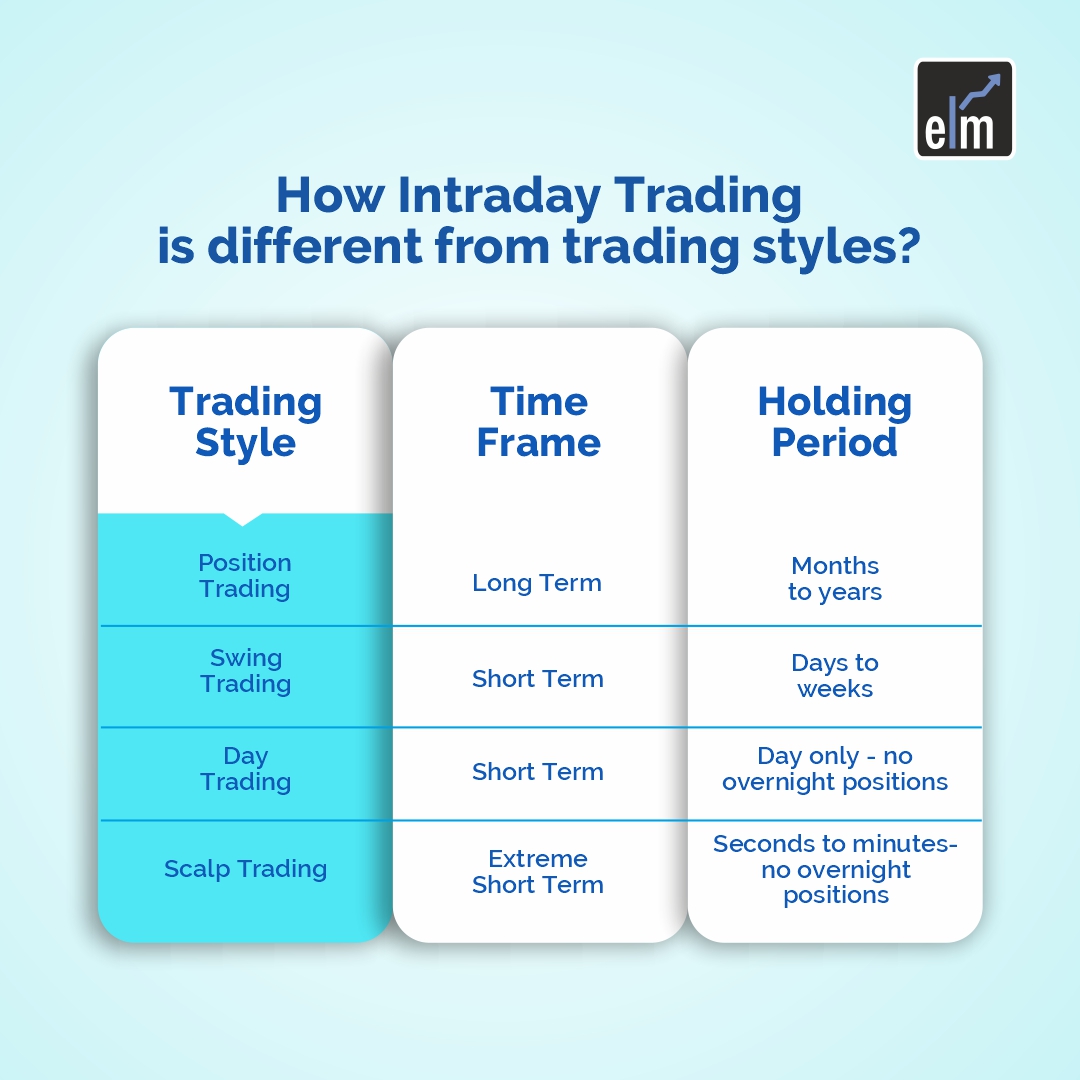
How is Intraday Trading different from trading styles?
While both positional and intraday trading strategies take advantage of the potential for profit in the stock markets, intraday trading does so by attempting to make the most money possible during the day.
Investors must maintain their positions in positional trading for a more extended period.
Compared to positional traders, who hold their positions overnight, intraday traders are exposed to less risk because they do not carry over their positions to the following day.
Both of these tactics have the potential to generate gains or losses. Positional trading could go wrong if you invest in the wrong stock at the wrong time.
Moreover, intraday trading could result in losses if you don’t have a stop-loss or profit target.
How to do Intraday Trading?
You must open a trading and DEMAT account before trading in the stock market. You could open a new account to keep your intraday trading separate if you are an experienced trader who wants to try out stock market intraday trading.
It is simpler to keep track of things when you have separate accounts. Due to the different tax treatments of intraday trades, keeping a separate account simplifies tax calculations.

After that, you can register for the appropriate intraday trading tools. After creating an account, you can obtain tools to help you with intraday trading.
Spend some time looking at daily charts before you start trading so you can become familiar with the patterns of price movement. There are many tools available that offer technical analysis, and these could also be beneficial.
What are the basic tools for intraday trading indicators?
Below are some basic intraday indicators that intraday traders may use for intraday Trading:
1. SuperTrend
Let’s start our discussion with the Supertrend indicator that can be used as an intraday trading indicator. This indicator is plotted on the price chart, and the current trend can be determined by its placement vis-a-vis price.
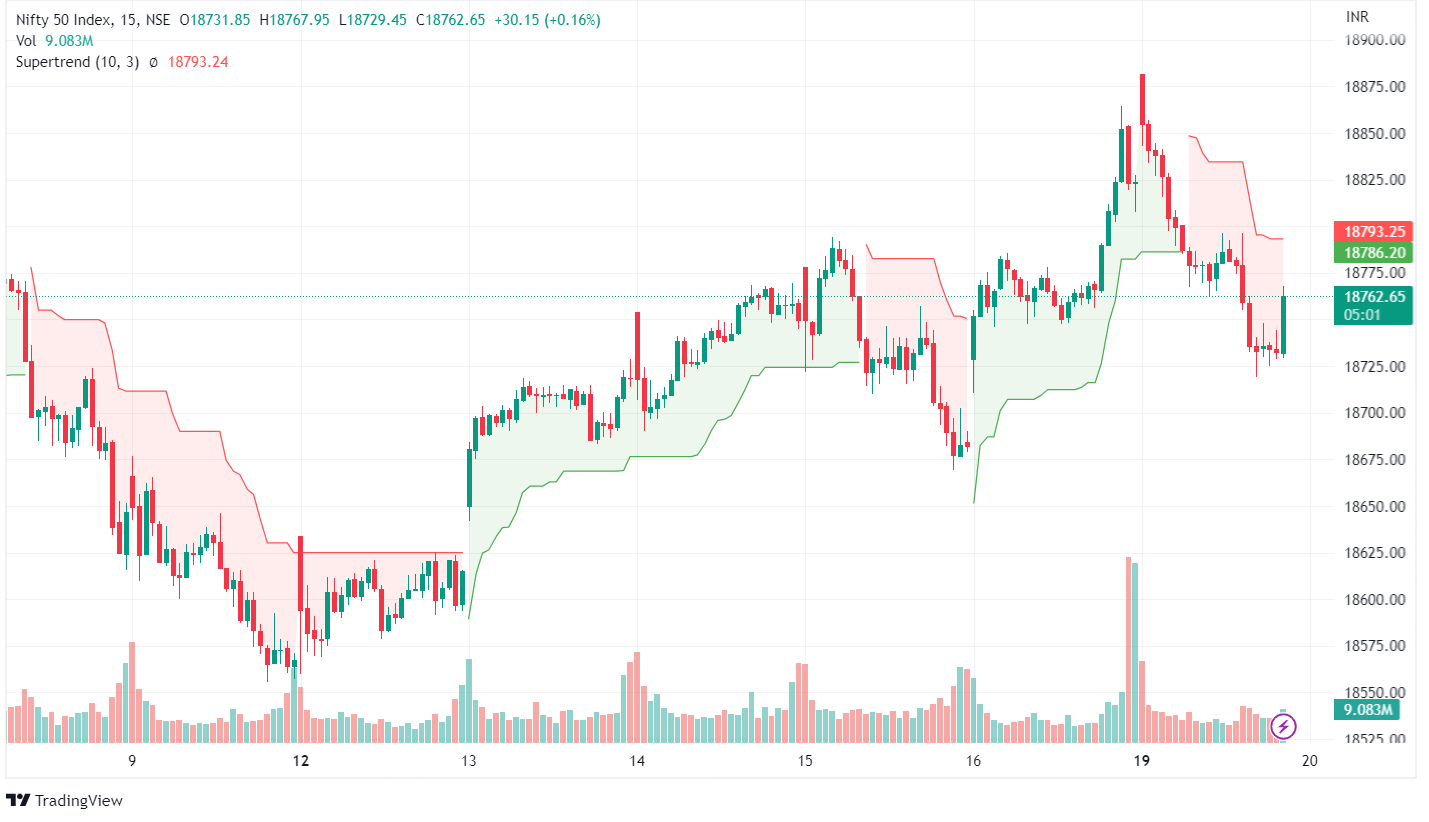
It is a very simple indicator constructed with just two parameters- period and multiplier.
2. VWAP
The second intraday trading indicator is VWAP- Volume Weighted Average Price. When trading intraday, traders need to track the volume of the stock.
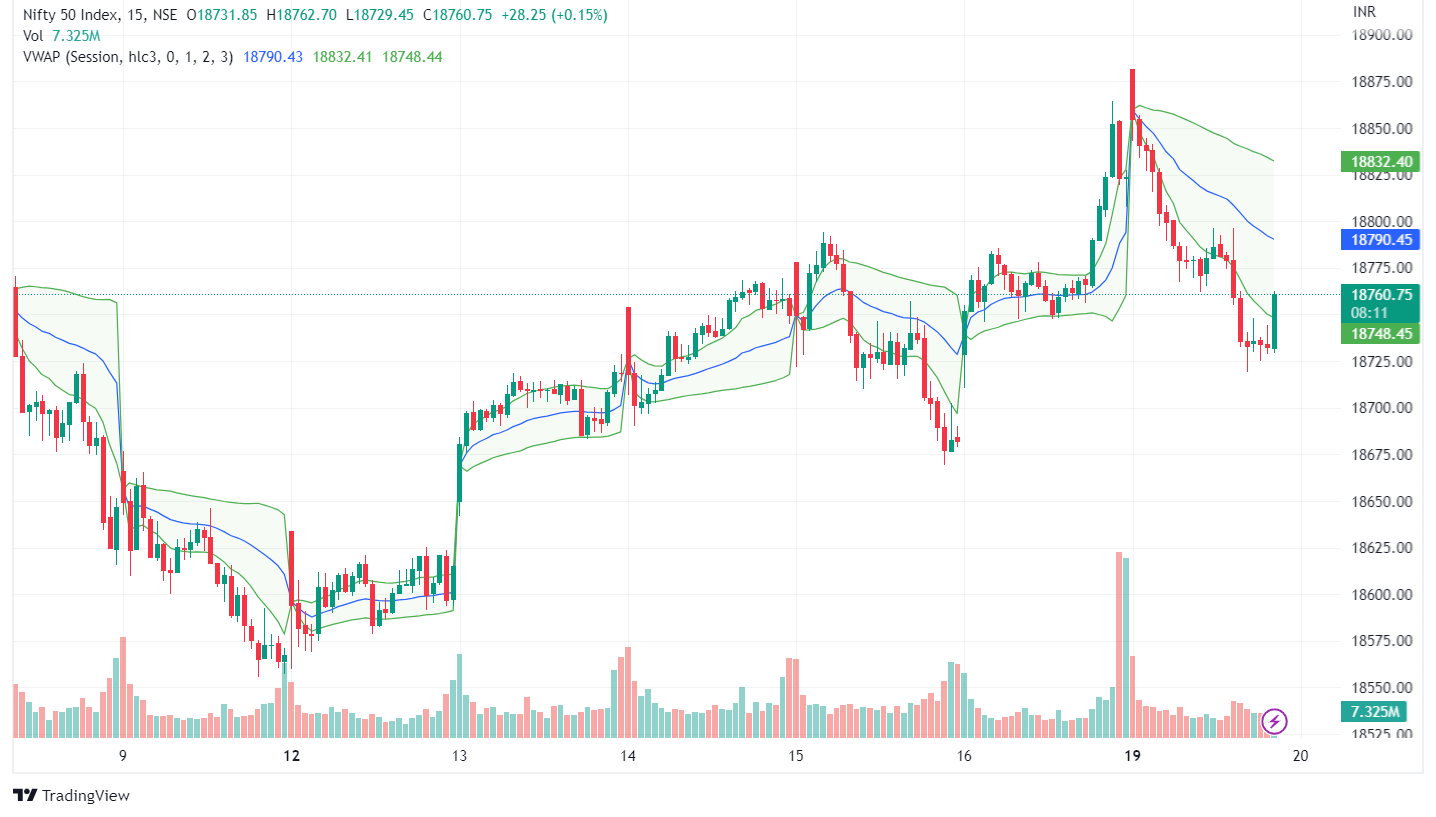
VWAP is a volume indicator of the ratio of the value of a stock trading at a particular time to the total volume traded at that stock for a specific stock.
3. On-Balance Volume
On Balance Volume (OBV) is a popular volume indicator that tracks the absolute volume change for speculating price movement. Most traders believe that volume drives price because of the aggressive trades from institutional investors.
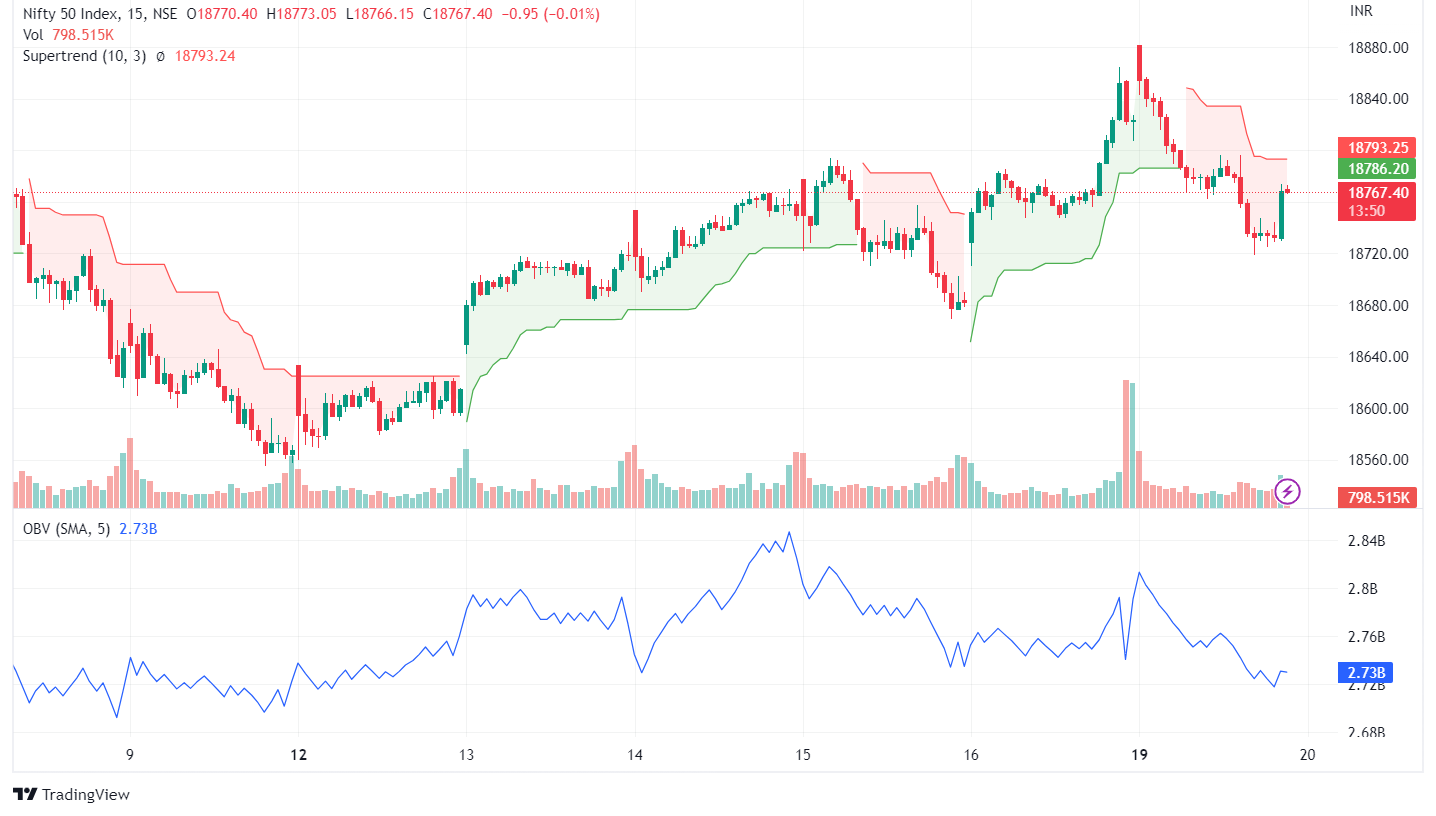
Thus, the On Balance Volume indicator helps us track this smart money flow into the market and signals future price direction.
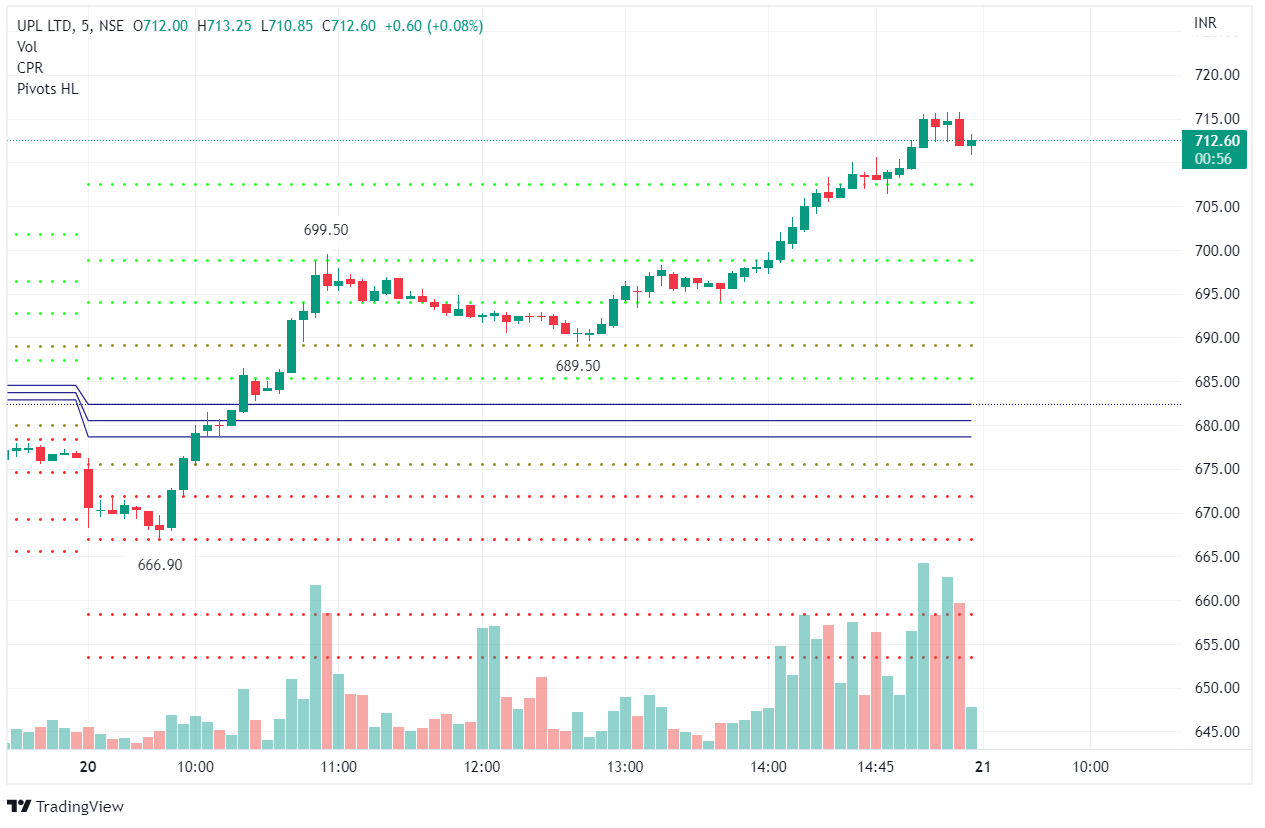
4. CPR
The Central Pivot Range (CPR) indicator is used to identify trade price-level pivot points. Traders can place trades based on the chart’s various levels.
It is very popular among traders because it is versatile and easy to understand. The CPR indicator has three levels, which are indicated on the chart.
These levels are known as pivot points, with the top central pivot point being the highest and the lowest central pivot point being the lowest.
How to Develop an Intraday Trading Strategy?
With intraday strategies, high-volume trading is the name of the game. The key is to enter a position, ride a brief trend, and exit a position just before the market closes to find the best intraday stocks.
The open high open low strategy is among beginners’ best intraday trading strategies. Although the accuracy rate varies between 50% and 70%, this strategy can help you succeed in intraday trading with proper risk and money management.
We wait 15 minutes after the market opens before looking for stocks where the opening is equal to the high or low for the day, according to the OHL strategy. When open = high for the day after 15 minutes, stocks began falling with heavy selling pressure almost immediately after the market opened. With the help of this strategy, you can find the best intraday stocks.
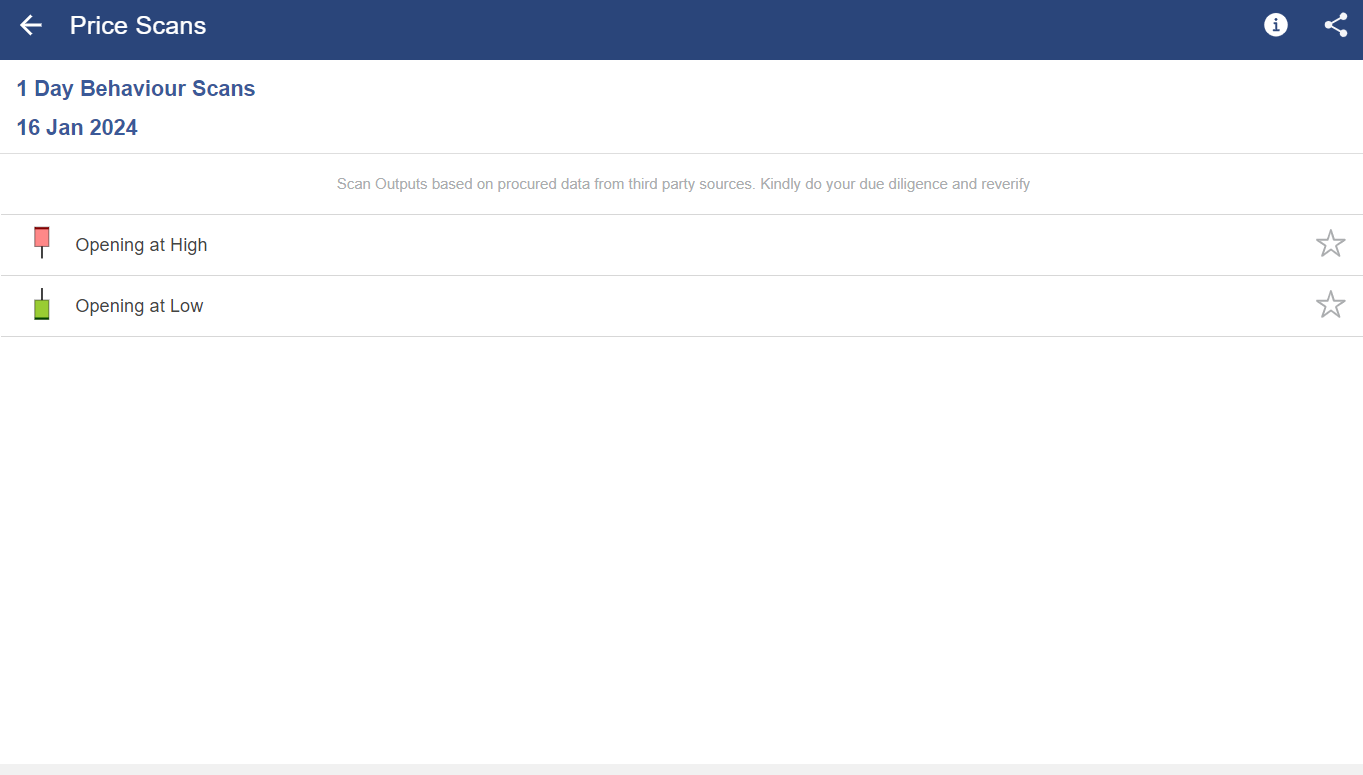
Many screeners exist for the open high open low strategy, but our favourite is StockEdge’s Open high low scanner, which can be found here.
How to do Risk Management in Intraday Trading?
The two strategies traders use to reduce losses and maximize gains are stop loss and take profit. If the market does not behave as anticipated, stop losses are used to minimize losses. Take profit as your desired income or what you expect from the market. You close your trade to realize your profit once the take profit is reached.
Pros and cons of Intraday Trading-
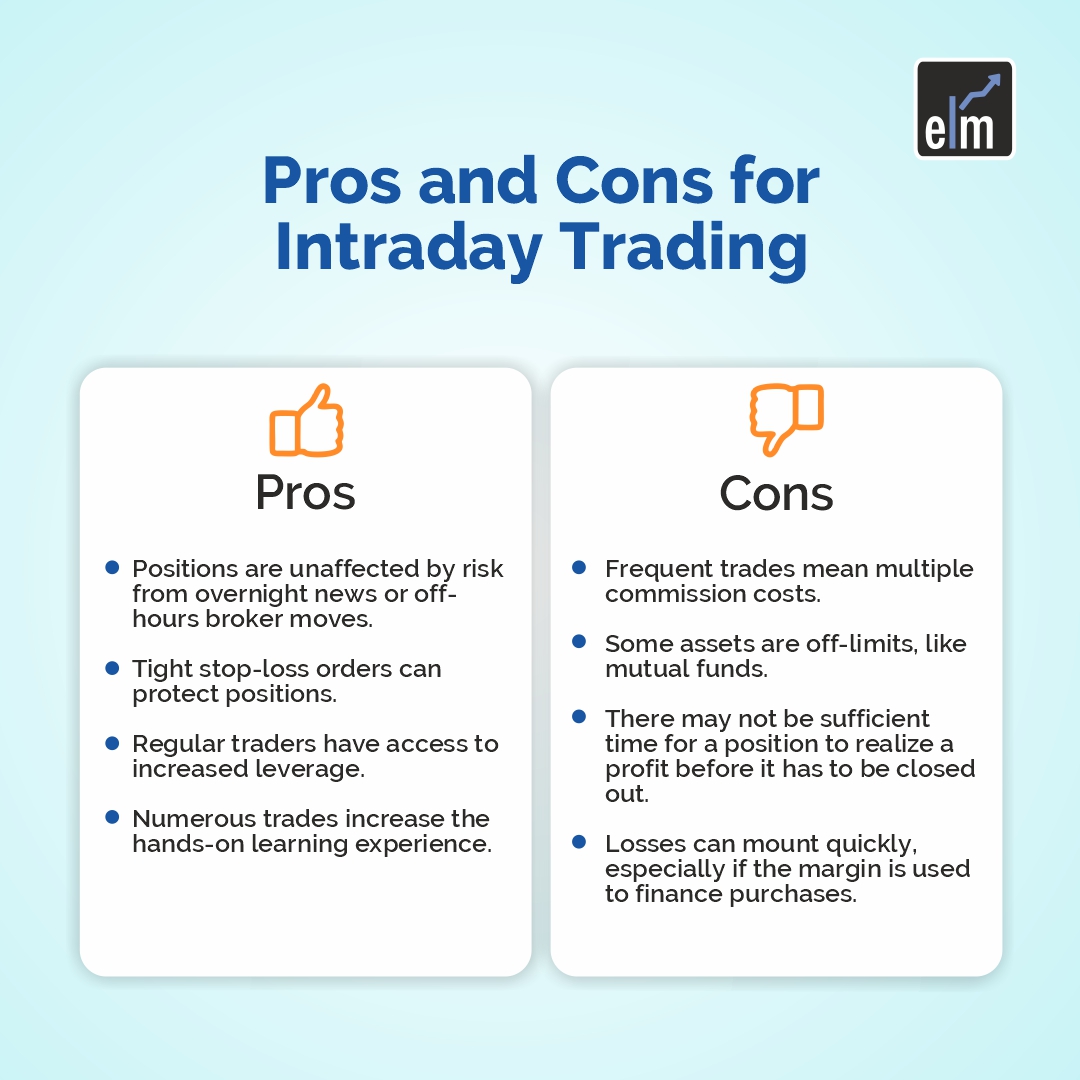
Pros-
- Compared to investments, intraday trading calls for a lower initial capital requirement.
- Due to the short waiting period for profits, you have the potential to earn sizable profits.
- When the stock market is highly volatile, you can make more money.
- If you trade intraday, you only need to lock in your money for a short time. You can use this to have money to engage in other frequent trading.
- Since day trading has lower risks, you will frequently be going long and short at the same time if you hold at least five small positions. This shows that at least one side of your investment portfolio will be profitable.
Cons-
- There is a chance of losing money more quickly when you are making money more quickly. Therefore, you must rely on something other than a fixed salary.
- You may experience psychological effects if you have a string of successful trades or if you are losing. Health-wise, this could be detrimental.
- Your success as an intraday trader becomes challenging when you disobey your trading diary and plan.
- If the market moves in a medium-term counter-trend direction, you could lose money on every position you have.
- It can be challenging to generate significant returns when the market is strongly trending.
To get trading strategies from stock market experts, join our comprehensive course on the TRADING MENTORSHIP PROGRAM
Conclusion
Intraday trading is a fast-paced and intense activity in which traders who make the right decisions can make significant profits quickly. There are losers, of course, and one thing to keep in mind is that intraday trading can be exciting. Recognizing this fact is critical because successful strategies remove as much emotion from trading as possible.
Frequently Asked Questions (FAQs)
How does intraday trading work?
Either the trader buys and sells the stock on the same day, or he or she sells it and then buys it back the following day. Delivery is not the result of intraday trading because there is no net position left at the end of the day. As a result, your Demat account is unaffected by intraday trading.
What is the best time for intraday trading?
The best intraday trading hours, according to many experts, are from 10.15 AM to 2.30 PM. By 10 to 10:15 AM, morning volatility frequently begins to decline, making this time ideal for intraday trades.


