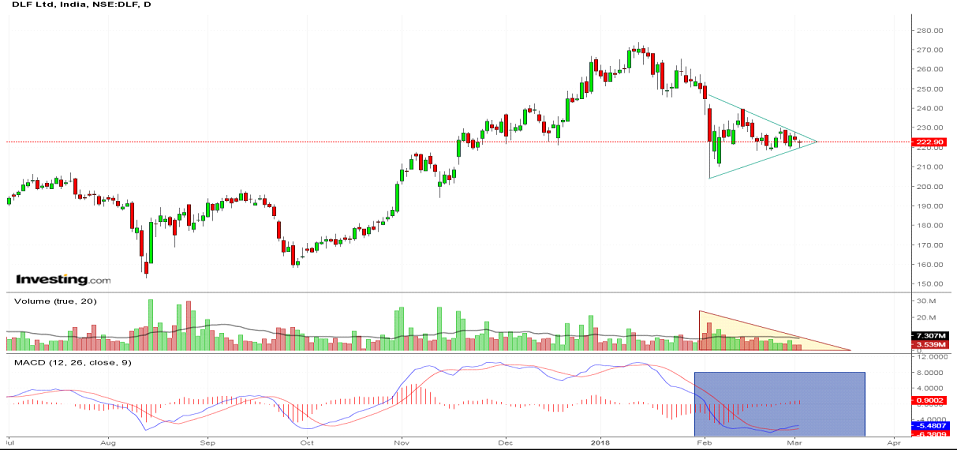

A Symmetrical Triangle Pattern is being formed by DLF Ltd. The stock also has made Inside Candlestick Pattern for two consecutive days. A major movement is expected to come in the stock. Volume is drying up and it is below 20 Days Moving Average, Few days back MACD gave a Crossover.(Not a reco to buy/sell/ hold)
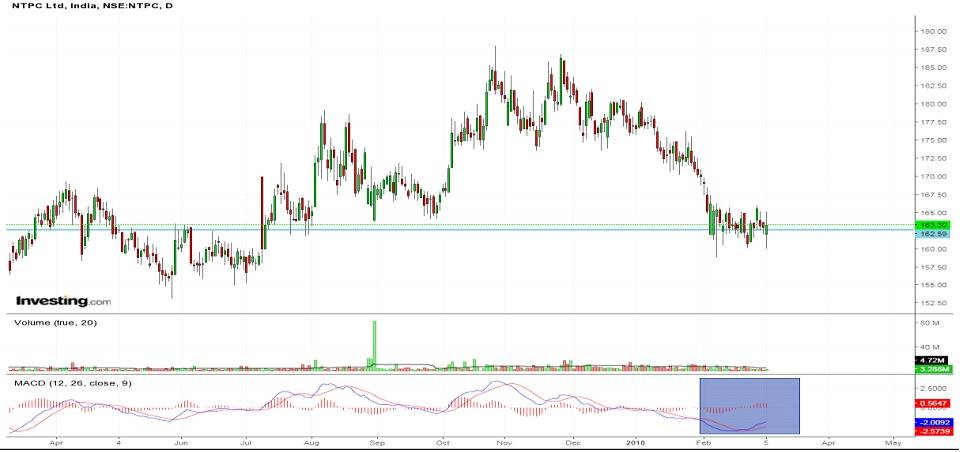
For last few weeks NTPC is trading at 160-166 level. The stock is in phase of Consolidation and this level has been a important Support Level for this stock. No significant change in volume is visible but MACD had a positive Crossover few days back.(Not a reco to buy/sell/ hold)
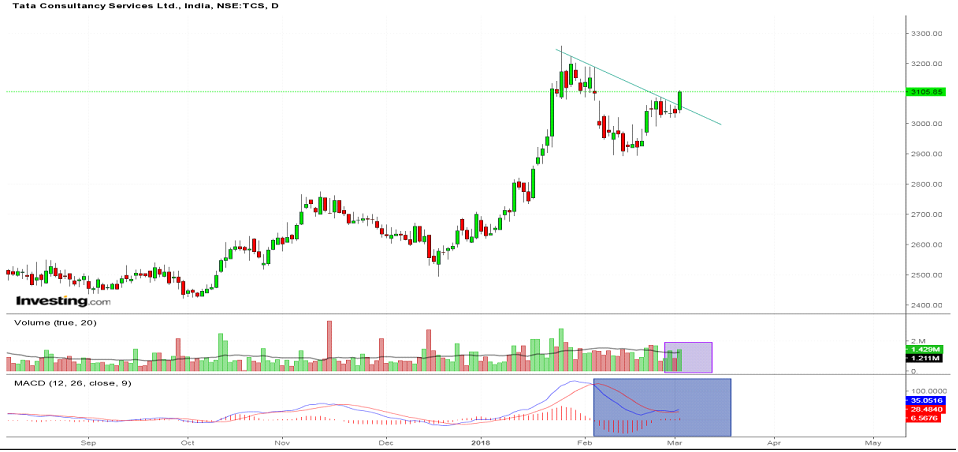
TCS gave a Breakout today from its previous Resistance Level. Today the stock has made a Green Candle which has a range of 3035.00-3112.70. Volume crossed 20 Days Moving Average line and MACD has a Positive Divergence in the chart.(Not a reco to buy/sell/ hold)
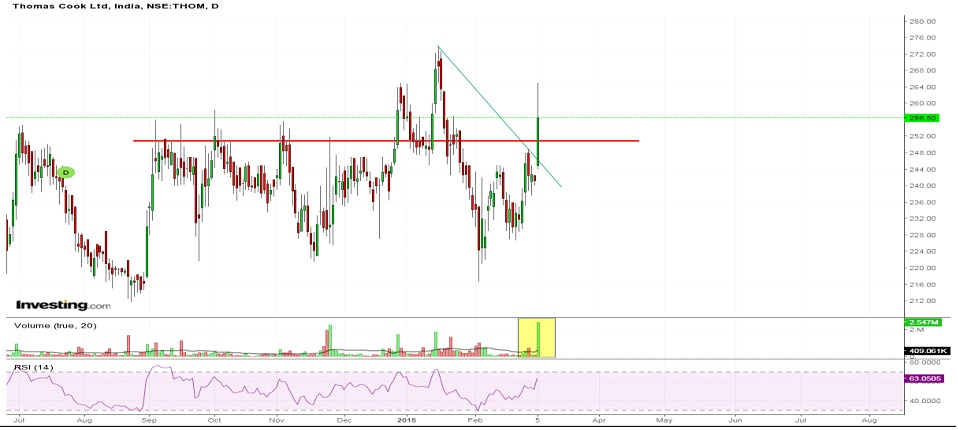
Thomas Cook able to breach its previous Resistance Level. Last month the stock was trading in a Consolidated zone, Today with huge volume the stock breached that Resistance Level while RSI is showing that the momentum of the stock is in the positive side.(Not a reco to buy/sell/ hold)


It’s really very helpful, Keep sharing.
Thank You for your comment
Great job. Great site Because when people will see your website so They will feel good. good blog. Keep sharing and posting.
Thank you for your comment.