Elearnmarkets - Financial Market Learning
  • Categories
    • Basic Finance
    • Derivatives
      • Futures
      • Options
    • Financial Planning
    • Fundamental Analysis
    • Technical Analysis
    • Marketshala
    • Miscellaneous
  • Language
    • English
    • Hindi
    • Bengali
No Result
View All Result
  • Courses
  • Webinars
  • Stories
Elearnmarkets - Learn Stock Market, trading, investing for Free
No Result
View All Result
Home Technical Analysis Market Analysis
Nifty Daily Chart

Nifty Closes Below 20 Week Moving Average After A Year, Closed Bearish On Global Rout:

Elearnmarkets by Elearnmarkets
August 22, 2023
in Market Analysis, Market Wrap
Reading Time: 2 mins read
0
34
VIEWS
Share on FacebookShare on XShare on WhatsApp

Nifty (weekly close approx. 10458.35):

This week Nifty opened on a Bullish Note and it surged towards the Top of the 10300-10630 range. However, Nifty after hitting top on Tuesday, corrected steadily throughout the week. However the fall in Nifty was muted compared to global rout, as q3 GDP data for India was better than street expectation. Nifty remained weak inside the range, but for the first time after more than a year Nifty closed below 20 week moving average. Hence next important support level for Nifty remains close to 34 week moving average, i.e. close to approx. 10255.
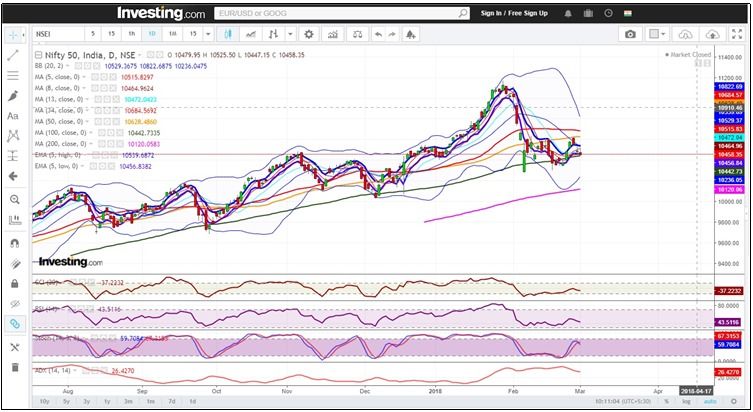
Nifty 50 daily technical analysis using Moving average, Bollinger Band and indicators RSI, ADX, CCI

Figure: Daily Chart

The daily RSI, CCI and Slow Stochastic indicators are lacking any directional momentum, while the daily ADX has shown signs of loss of momentum. The hourly RSI and Slow Stochastic are closed near bottom end of the range while the hourly CCI closed below the oversold zone. This indicates loss of upward momentum and possibility of downward move. On Thursday Nifty closed just near 5 day low EMA. A decisive move below this EMA may take Nifty towards the bottom end of the 10300-10630 range or 200 day moving average (approximately at 10120) now.

Nifty Closes Below 20 Week Moving Average After A Year, Closed Bearish On Global Rout: 1

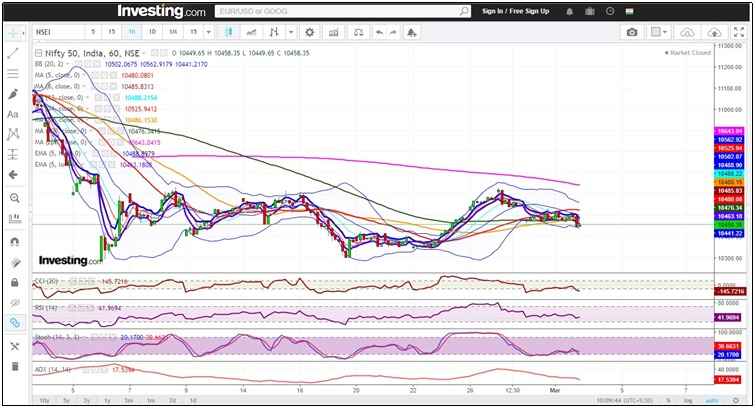
Figure: Hourly Chart

Technical possibilities for upcoming week:

Next week Nifty may find direction based on both global and domestic news flow. The rub-off of positive surprise in GDP data or electoral outcomes may restrict downside, however a sustained down move in US and Asian markets may break the resolve of Nifty bulls. On the downside 34 week moving average (approx. 10250), 200 day moving average (approx. 10120) are important levels if 10300-10650 range breaks. On the upside 10630 is a very steep resistance.

RelatedPosts

Weekly Chart

Huge Sell-Off Makes the Market Close in a Negative Note on the Expiry Week

August 22, 2023
191
Hourly Chart

Nifty Ends in Green. Rupee Appreciates and Falling Crude Price Helped the Market to Recover Approx. 140 Point

August 31, 2023
133
Hourly Chart

Sell Off Continues. Nifty Ends The Week With Three Consecutive Red Candles

September 4, 2023
147
Nifty-Weekly-Chart.png


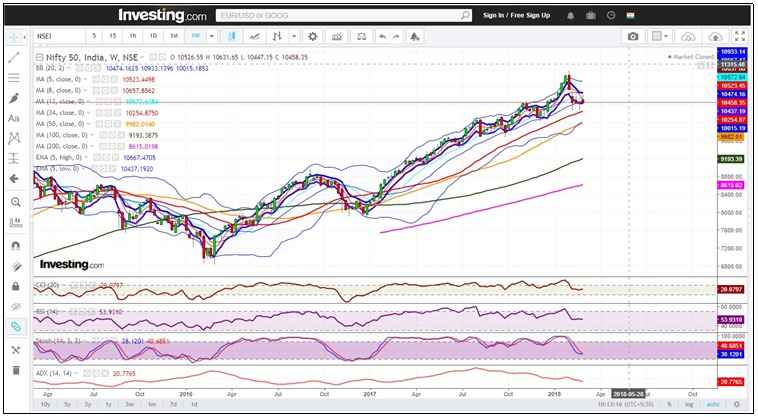
Figure: Weekly Chart

We are including the ELM level matrix for Nifty for Monday 5th March for your reference.

ELM Analytics Level spot nifty


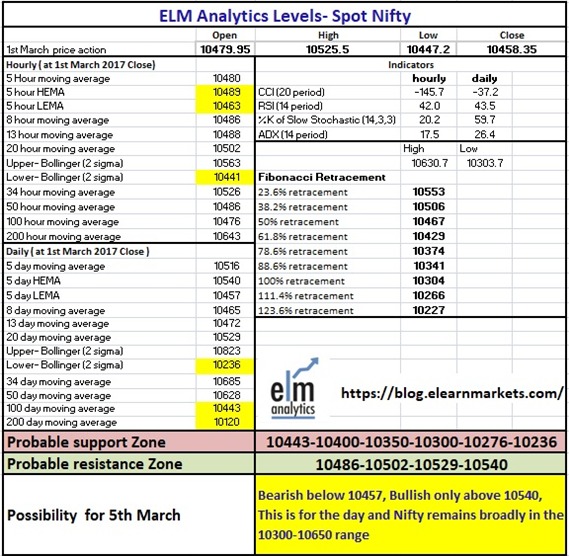
Figure: ELM Nifty level Matrix 5th March

ShareTweetSend
Get Kotak Offer Get Kotak Offer Get Kotak Offer
Previous Post

Charts of the day – 26th Feb, 2018

Next Post

Charts of the day – 5th March, 2018

Elearnmarkets

Elearnmarkets

Elearnmarkets (ELM) is a complete financial market portal where the market experts have taken the onus to spread financial education. ELM constantly experiments with new education methodologies and technologies to make financial education effective, affordable and accessible to all. You can connect with us on Twitter @elearnmarkets.

Related Posts

Weekly Chart
Market Analysis

Huge Sell-Off Makes the Market Close in a Negative Note on the Expiry Week

August 22, 2023
191
Hourly Chart
Market Analysis

Nifty Ends in Green. Rupee Appreciates and Falling Crude Price Helped the Market to Recover Approx. 140 Point

August 31, 2023
133
Hourly Chart
Market Analysis

Sell Off Continues. Nifty Ends The Week With Three Consecutive Red Candles

September 4, 2023
147
Nifty Hourly Chart
Market Analysis

Nifty Witnessed A Flash Crash But Managed To Close Above 11100 Level

August 17, 2023
349

Leave a Reply Cancel reply

Your email address will not be published. Required fields are marked *

Elearnmarkets Logo

Follow Us

Facebook-f Twitter Instagram Linkedin-in Youtube Telegram

Register on Elearnmarkets

Continue your financial learning by creating your own account on Elearnmarkets.com

Register Free Account

Download App

Playstore logo
Download on app store

Categories

  • Basic Finance
  • Derivatives
  • Financial Planning
  • Fundamental Analysis
  • Technical Analysis
  • Marketshala
  • Miscellaneous

Popular On Elearnmarkets

  • Market Superheroes:
  • Vivek Bajaj
  • Chetan Panchamia
  • Ashish Kyal
  • Premal Parekh
  • Abhijit Paul
  • Jegan
  • Sivakumar Jayachadran
  • Vishal Malkan
  • Jyoti Budhia
  • Vivek Gadodia
  • Vishal Mehta
  • Piyush Chaudhry
  • Santosh Pasi
  • Gomathi Shankar
  • Market Superheroes:
  • Vivek Bajaj
  • Chetan Panchamia
  • Ashish Kyal
  • Premal Parekh
  • Abhijit Paul
  • Jegan
  • Sivakumar Jayachadran
  • Vishal Malkan
  • Jyoti Budhia
  • Vivek Gadodia
  • Vishal Mehta
  • Piyush Chaudhry
  • Santosh Pasi
  • Gomathi Shankar
  • Courses:​
  • Options Trading
  • Dow Theory
  • Momentum Trading
  • Stock Investing
  • Stock Market for Beginners
  • Harmonic Chart Patterns
  • Algo Trading
  • Elliot Wave Theory
  • Advanced Excel
  • Cryptocurrency
  • NSE Certification Course
  • Courses:​
  • Options Trading
  • Dow Theory
  • Momentum Trading
  • Stock Investing
  • Stock Market for Beginners
  • Harmonic Chart Patterns
  • Algo Trading
  • Elliot Wave Theory
  • Advanced Excel
  • Cryptocurrency
  • NSE Certification Course
  • Webinars:
  • Bank Nifty Scalping
  • Intraday Trading Strategies
  • Options Trading Strategies
  • Options selling
  • Price Action
  • Relative Strength
  • Tax Planning
  • Options Buying
  • Growth Stocks
  • Portfolio Management
  • Relative Strength Index
  • Risk Management
  • Renko Charts
  • Crude Oil
  • Traders Psychology
  • Moving Average
  • Multibagger Stocks
  • Free Learning Modules:
  • Intraday Trading
  • Options Scalping
  • Swing Trading
  • Financial Modelling
  • RSI Indicator
  • Bollinger Bands
  • Pricing of Futures
  • Personal Finance
  • Initial Public Offerings (IPO)
  • Value Investing
  • Technical Indicators
  • Candlesticks
  • Chart Patterns
  • Option Greeks
  • ELSS Funds
  • Banking and Insurance
  • Real Estate
  • Gold
  • Book Summaries:
  • Rich Dad Poor Dad
  • Psychology of Money
  • The Intelligent Investor
  • The Richest Man in Babylon
  • Think and Trade Like a Champion
  • Value Investing and Behavioural Finance
  • Trading in the Zone
  • Learn to Earn
  • Book Summaries:
  • Rich Dad Poor Dad
  • Psychology of Money
  • The Intelligent Investor
  • The Richest Man in Babylon
  • Think and Trade Like a Champion
  • Value Investing and Behavioural Finance
  • Trading in the Zone
  • Learn to Earn
  • Tools:
  • CAGR Calculator
  • SIP Calculator
  • eLearnOptions
  • Future Value Calculator
  • Present Value Calculator
  • Atal Pension Yojana
  • Cost of Delay Calculator
  • Become a Crorepati
  • Tools:
  • CAGR Calculator
  • SIP Calculator
  • eLearnOptions
  • Future Value Calculator
  • Present Value Calculator
  • Atal Pension Yojana
  • Cost of Delay Calculator
  • Become a Crorepati

© 2023 Elearnmarkets. All Rights Reserved

  • Visit Elearnmarkets
  • Courses
  • Webinars
  • Financial Guides
  • Get Free Counselling
  • Visit Elearnmarkets
  • Courses
  • Webinars
  • Financial Guides
  • Get Free Counselling

Get Elearnmarkets App

No Result
View All Result
  • Article Categories
    • Basic Finance
    • Derivatives
    • Financial Planning
    • Fundamental Analysis
    • Technical Analysis
    • Marketshala
    • Miscellaneous
  • Language
    • Hindi
    • Bengali
    • English
  • Courses
  • Webinars
  • Stories

© 2020 Elearnmarkets All Rights Reserved